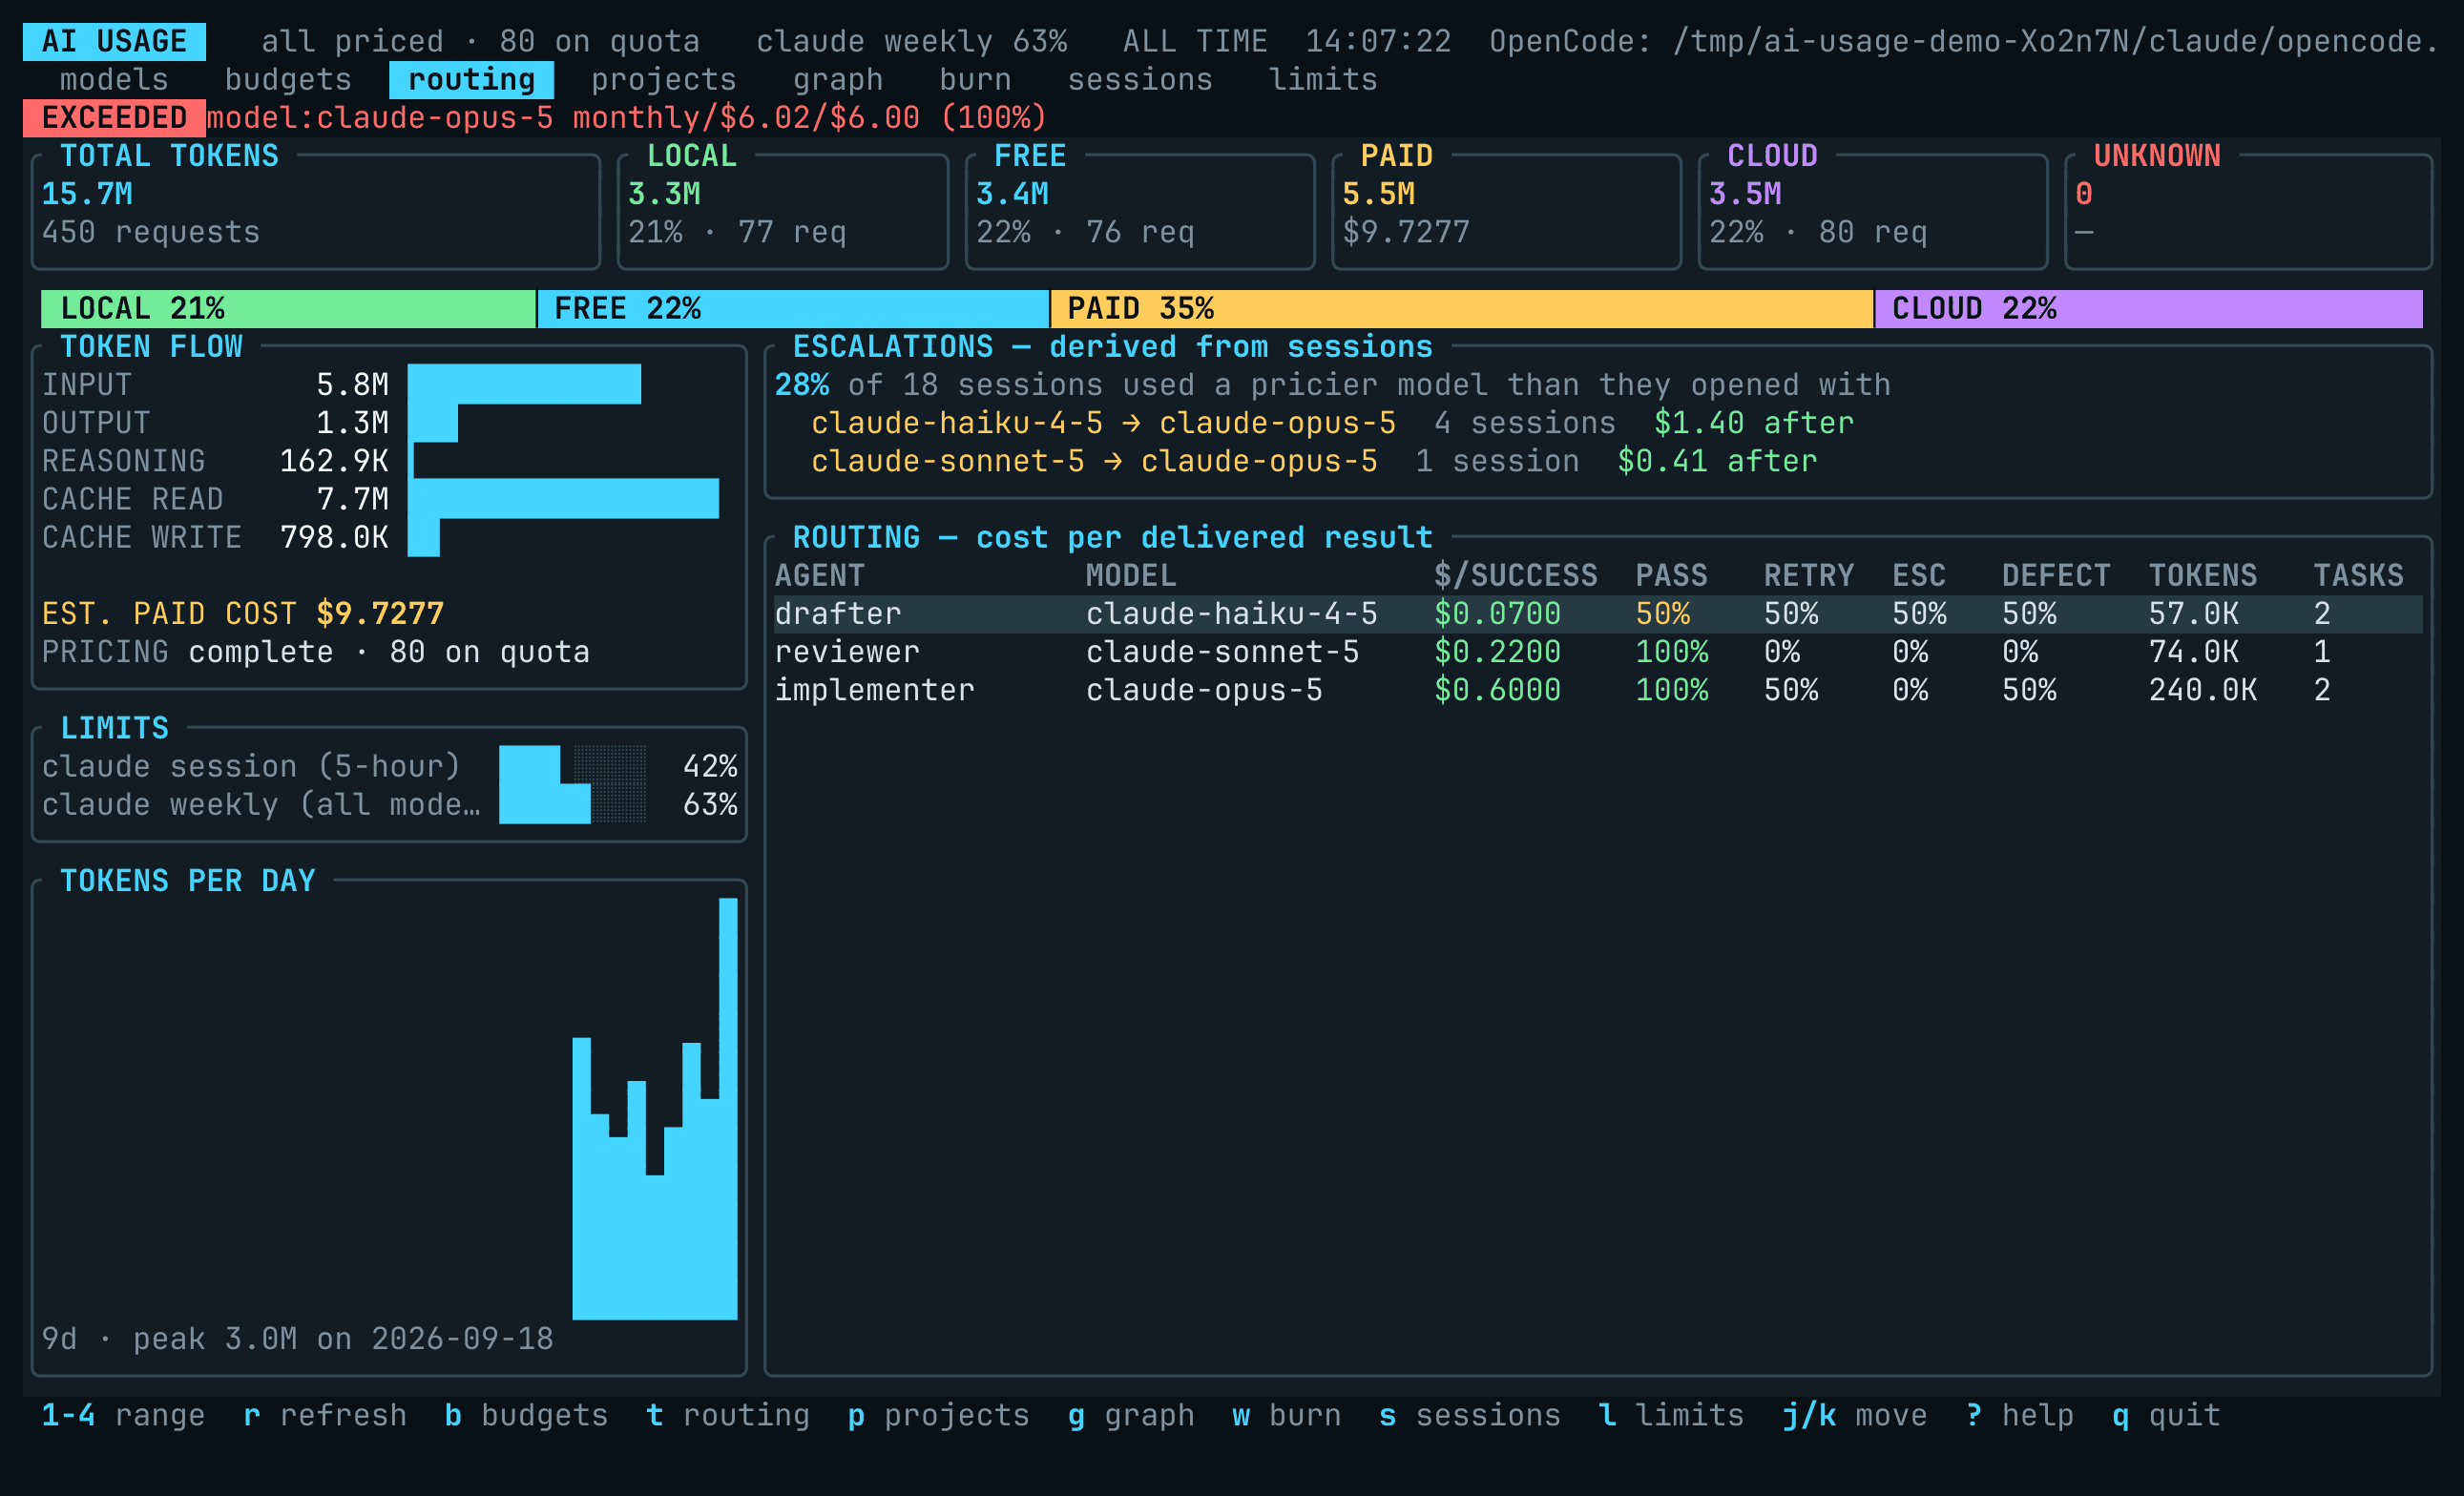
Model-routing analytics
This answers a question a usage total cannot: is the expensive model actually
earning its cost on your work? A model that costs 5x more but lands the change
on the first try can be the cheaper one. The panel ranks agent/model pairs by
cost per delivered result — dollars spent per passing test — alongside the
retry, escalation, and review-defect rates behind that figure.
A pair that never reported a test result — or a retry, escalation or defect
count — shows —, not 0%. Never having been measured is not the same as
failing everything, or as never needing a second attempt.
The panel also shows an escalations block derived from usage already
collected, which needs no setup at all: how often a session reached for a
pricier model than it opened with, and what that cost. Derived and recorded data
are shown as separate blocks and never merged — nothing this tool inferred
should look like something your harness measured. See
docs/routing-analytics.md.
Routing events are separate, opt-in records for evaluating model-selection
outcomes. For Claude Code, ai-usage-tui --install-hook registers --claude-code-hook
on its PostToolUse and PostToolUseFailure hooks, appending to whatever hooks are
already there (contrib/claude-code/ is the block it
merges, for doing it by hand):
every test run the agent makes is journaled, pass or fail, attributed to the model
that ran it and to the requests the attempt took — and nothing the hook could not
observe is sent, so retries and defects stay “not reported” rather than 0. For
any other harness, emit one event per task from whatever drives your agents, as
JSON on stdin:
echo '{
  "agent":"@heavy",
  "model":"glm-5.2:cloud",
  "provider":"opencode",
  "task":"refactor",
  "phase":"implementation",
  "tokens":15000,
  "cost":0.02,
  "retries":1,
  "escalations":0,
  "test_result":true,
  "review_defects":0
}' | ai-usage-tui --record-routing
agent, model, task, and tokens are the useful minimum fields. Optional
fields include provider, phase, category, cost_status, requests,
cost, retries, escalations, test_result, review_defects, an event_id,
and a Unix created timestamp. A missing counter is stored as not reported —
never as zero — and shows as —; requests defaults to one, and missing strings
use empty or unknown values. A counter that is not a non-negative integer, or a
test_result that is not a boolean, 0/1, "pass" or "fail", is refused.
View aggregates with t in the TUI or export them:
ai-usage-tui --routing-json
ai-usage-tui --routing-csv routing.csv
Routing output is aggregated by agent, model, and provider. JSON also includes
retry, escalation, and defect rates — the share of tasks that reported a count
and had one, null when none did. Routing CSV columns are:
agent,model,provider,tasks,tokens,cost,retries,escalations,test_passes,
test_failures,review_defects,priced_tasks,unpriced_tasks,quota_tasks,free_tasks,
retries_observed,escalations_observed,review_defects_observed
See docs/routing-analytics.md for the underlying
design and examples/model-routing.toml for an
example routing policy. The policy is an orchestration example; the binary
does not load it automatically.
Routing Analytics
Routing analytics answer a question a usage total cannot: is the expensive model earning its
cost? A model at twice the token price that lands the change first time can be cheaper per
delivered result than a cheap one that needs three attempts.
The t panel has two blocks, and the split between them is deliberate.
| Block |
Where it comes from |
What it can say |
| ESCALATIONS |
Derived from usage already collected. No setup. |
Which sessions reached for a pricier model than they opened with, and what that cost |
| ROUTING |
Recorded by your harness via --record-routing, or by the Claude Code hook |
Cost per passing test, retry / escalation / defect rates |
They are never merged. A measured pass rate and an inferred transition would be
indistinguishable in one table, which is the same failure CostStatus exists to prevent one
level up: nothing this tool inferred should look like something it observed.
Derived escalations
For each session with more than one request, the model it opened with is compared against every
model it used afterwards. If any of them costs more per input token, the session escalated. The
block reports how many sessions did, the most common opening-to-priciest pairs, and the spend on
models above the opening rate.
What it does not claim:
- An escalation is not a failure of the cheaper model. Tasks get harder. The number supports
“this happens N times in M sessions and costs this much”, not a verdict.
- It is not a routing event. Derived transitions are never written to the journal or folded
into recorded aggregates.
- It does not guess at unknown prices. Ordering two models needs a price for both. Without
one, the change is reported as unranked rather than assumed flat — so a low escalation count
is distinguishable from a count taken with one eye shut.
Counting is per session, not per model switch. Sessions interleave models rather than stepping
up once; a real session switched models 20 times, 10 of them upward. Counting each switch and
attributing the spend that followed reported $233 of escalated spend for a $29 session. Each
session is characterised once and each request counted once, so the reported figure cannot
exceed what the sessions actually cost.
Sessions without a session id are skipped rather than pooled — pooling would invent adjacency
between unrelated requests.
Recording Routing Events
Record a routing event from stdin (JSON):
echo '{"agent":"@heavy","model":"glm-5.2:cloud","task":"refactor","tokens":15000,"cost":0.02,"test_result":true}' | ai-usage-tui --record-routing
No field is required. agent, model, task and tokens are the useful minimum — an event
without them is stored, but aggregates under unknown with nothing to count. Anything omitted
takes a default:
| Field |
Default |
agent, model, provider |
unknown |
task, phase |
empty string |
requests |
1 (values below 1 are raised to 1) |
tokens |
0 |
retries, escalations, review_defects |
null — not reported, which is not 0 |
category |
UNKNOWN |
cost_status |
reported when a cost is given, otherwise unavailable |
cost |
null — no cost, not $0.00 |
test_result |
null — unobserved, not a failure |
created |
now |
The full optional set: provider, phase, category, cost_status, requests, cost,
retries, escalations, test_result, review_defects, event_id, created (unix seconds).
test_result is a boolean, 0/1, or "pass"/"fail" in any case; retries, escalations,
review_defects, tokens and requests are non-negative integers (an integral float such as
2.0 counts, for emitters in loosely typed languages). Anything else is refused with an error
naming the field, before the journal is touched, rather than stored as 0 or null under a
success message — an emitter that sends "test_result":"pass" to a recorder that
silently drops it never learns.
Events are deduplicated on event_id, which is yours if you send a non-empty one and otherwise
routing:{agent}:{model}:{task}:{created}; a second event with the same identity is ignored, not
updated. An empty event_id is treated as absent rather than as one identity shared by every
event from a template whose variable was unset. Two events with the same agent, model and task recorded in the same second therefore
collapse into one unless one of them carries an event_id — send one when batching.
Recording from Claude Code
--claude-code-hook is a shipped emitter: Claude Code’s own hooks, recording every test run
the agent makes. ai-usage-tui --install-hook registers it on PostToolUse and
PostToolUseFailure for the Bash tool, appending to whatever hooks are there;
contrib/claude-code/settings.json is the block it
merges, and the README there covers doing it by hand and
verifying it. The hook
reads the payload Claude Code writes to its stdin and, when that payload observed a test run,
journals one event through the same path --record-routing takes.
Which event fired is the result. Checked against what Claude Code 2.1.245 sends, not its
reference: a Bash command that exits non-zero fires PostToolUseFailure (with the status in
error), and PostToolUse’s response for Bash carries no exit code at all. Register one event
without the other and only passes, or only failures, are recorded.
When the hook itself fails – a journal it cannot write, a config that does not parse – it
says so on stderr and exits 1, not the 2 every other command fails with. Claude Code reads a
hook’s status: measured on 2.1.275, a PostToolUse hook that exits 2 has its stderr given to
the model as something to act on, and a journal that could not be written is not the model’s to
fix. With exit 1 the same run told the model nothing.
What counts as a test run. The command line must contain a recognised runner at the head of
a simple command — cargo test, pytest, npm test, go test, just test, just check, make check and
some forty others, through wrappers like npx, uv run, timeout and leading VAR=value
assignments; the list is RUNNERS in src/harness/shell.rs. Matching is on the command’s
leading tokens, so grep "cargo test", echo cargo test and cat test.log are not test runs.
Whose status the hook sees. The exit status is the line’s, not the runner’s, and the two
differ in ways that would record a wrong result. So the status decides only when it is the
runner’s own, in that direction:
| Line |
The status says |
cargo test, RUST_BACKTRACE=1 cargo test, cargo build; cargo test |
pass and fail |
cargo build && cargo test |
pass only — a failure may be the build’s, before a test ran |
cargo test && cargo clippy |
pass only — a failure may be clippy’s |
cargo test 2>&1 | tail -20 |
nothing — the status is tail’s |
cargo test; echo done, cargo test || true, cargo test & |
nothing — the runner’s status is discarded |
cargo check || cargo test |
nothing — the tests ran only if the check failed |
a runner on a line with $(…), backticks or a heredoc |
nothing — the line cannot be read reliably |
When the status says nothing, the runner’s own summary does. Measured on the author’s machine
over eighteen days, the first table’s bottom four rows were 841 test runs of 845: every test
command there is trimmed through grep, tail or head so its output fits a tool result, and
the hook recorded two events and said nothing about the rest. Captured from Claude Code, cargo test 2>&1 | grep -E "^test result|FAILED" with a failing test fires PostToolUse — the
success hook — so the status was never going to be a way in. The runner’s summary line is still
in the payload (tool_response.stdout, or error for PostToolUseFailure), and for a line
whose status does not speak, that line decides — against the hook event when they disagree:
| Runner |
Read as a pass |
Read as a failure |
cargo test |
test result: ok. |
test result: FAILED., test … ... FAILED, error: test failed, error: N target(s) failed |
pytest |
N passed in 0.01s |
N failed, …, N error(s), …, FAILED path::test, ERROR path |
go test |
ok pkg 0.001s |
FAIL, FAIL pkg, --- FAIL: Test |
deno test |
ok | N passed | 0 failed |
FAILED | …, error: Test failed |
make, just, npm/pnpm/yarn/bun run scripts, tox, rake, composer |
any of the above |
any of the above |
Every marker is a line that runner really printed, kept under tests/fixtures/hook/. A runner
with no captured output has no marker — jest, vitest, nextest and the rest are recognised and
their piped runs stay unrecorded — and adding one starts with a capture, not with its
documentation (CONTRIBUTING.md, “Capturing a Claude Code hook payload”).
The two directions are not treated alike. A failure marker is always believed: a filter can
hide one, it cannot make one. A pass needs the end of the output to be there, because the end
is where each of these runners puts a failure: tail keeps it; a head that filled its limit, or
whose limit cannot be read, may have cut it, and then no pass is recorded. A line that selects
passing summaries by name (grep "test result: ok") can never show a failure and never yields a
pass. The output is read for a verdict and dropped; nothing of it is stored.
What could not be recorded is counted. A test run with neither a status nor a summary to go
on — cargo test | head -3, pnpm test >/dev/null; echo done — records no event and adds one to
a tally in the journal: the UTC day, the agent and the reason, and nothing else (no command line,
which can carry a credential; no output). --doctor prints it under CLAUDE CODE, the routing
panel’s title carries the total, and --routing-json and --summary-json export it as
withheld. The reasons are pipe, sequence, or_after, after_or, background,
substitution and and_chain. Read it beside events: two events and 800 withheld is a
coverage gap, two events and none is a quiet machine. A re-delivered hook counts twice — a tally
has no identity to refuse it by — so treat it as a close count, not an exact one.
The hook prints what it did (Recorded a failing test run …, from the runner's summary line,
Counted a test run and recorded nothing: …, Nothing to record: not a test run), which claude --debug shows. An interrupted command, and one run with run_in_background, has no outcome in
its payload and is never recorded or counted.
What the event carries.
| Field |
Source |
test_result |
Which hook fired, or the runner’s summary line when the line’s status is not the runner’s |
agent |
claude-code, or claude-code:<agent_type> inside a subagent |
model, provider |
The last request in the transcript the payload names — the model in use — and anthropic |
requests, tokens |
The attempt: every request in the transcript that no earlier event of this session has attributed. One API request is written as several assistant lines sharing a requestId; they count once |
cost, cost_status |
The attempt priced as the dashboard prices its rows: the same billing decision (--claude-billing, ~/.claude.json, Omarchy’s record) and the same rate table. A Max or Pro account’s attempt is quota — real work, no per-request figure — and the panel renders it on quota. Any request that should carry a price and does not makes the whole attempt unavailable |
task, phase |
The working directory, as the Projects panel names it, and test |
event_id |
claude-code:<session_id>:<scope>:<tool_use_id> — scope is main or agent-<agent_id> — so a re-delivered hook cannot record a run twice |
retries, escalations, review_defects |
Never sent. A hook cannot count them, so they stay not reported and the panel reads —, not 0% |
The transcript is read with the Claude Code collector’s own parse_line, which takes the usage
block, the model and the timestamp from each assistant line and nothing else; a test plants a
credential in the content and fails if it reaches the event. A transcript that cannot be read
still records the run — the pass or fail was observed — with nothing attributed, and says so in
the log (AI_USAGE_LOG).
The attempt runs one request late. Claude Code appends the assistant line that issued a
tool call after the tool and its hooks have run, so when the hook reads the transcript it
ends one request early — and that request’s timestamp is earlier than the hook’s, which is why
the attempt is bounded by a cursor and not a clock. The cursor is how many requests this
session’s earlier events attributed; everything past it is this attempt. Each request is counted
exactly once, and the request that issued a test command lands in the attempt behind the next
run. Over a session the sums are the same; the first run’s attempt is everything before it, and
the last run’s issuing request is attributed to no run. For the same reason model is the model
in use when the hook ran, which right after a model switch is the model before it.
Subagents. Claude Code hands a subagent’s hook the parent’s transcript_path and the
parent’s session_id; the subagent’s own turns are written to
<project>/<session_id>/subagents/agent-<agent_id>.jsonl, every line marked isSidechain: true.
Reading the payload’s path therefore charged a subagent’s run to the parent’s requests and the
parent’s model — measured against a real session, a make test came out as 3 requests and 65,598
tokens when the agent that ran it had spent 2 and about 318. The harness now prefers that nested
transcript when the payload carries an agent_id, and the journal cursor is keyed on the agent as
well as the session, so a subagent’s attempts and its parent’s no longer share one counter. A
payload with no agent_id, or a build that lays subagents out differently, falls back to the
path the payload names.
What it does not do. It does not run on Codex or Gemini, which have no equivalent hook
surface today. An attempt with no request in it — a session whose first Bash call is a test run —
records tokens: 0 and unavailable, and does not advance the cursor.
Exporting Analytics
Export the aggregates as JSON — {schema_version, source, events: <count>, aggregates: [...]}.
Individual events are not exported:
ai-usage-tui --routing-json            # all history
ai-usage-tui --routing-json --month    # a range flag narrows it, when one is given
Without a range flag this has always meant all history, and still does: the default range
everywhere else is a week, and applying that unasked would have shrunk every existing script’s
output. Each aggregate carries cost_per_success with the cost_basis it rests on, the three
counters with their _observed denominators and rates, and success_rate — the share of tasks
with a recorded test result that passed, null when none recorded one. ai-usage-tui --schema
defines every key, and every cost_basis value:
cost_basis |
cost_per_success |
why |
exact |
a figure |
every contributing task carried a price |
free |
0 |
every task was free or local: a real zero |
floor |
null |
some spend was priced and some was not; a minimum is not printed as the figure (cost holds the priced part) |
plus_quota |
null |
some tasks were priced, the rest billed against a plan |
quota |
null |
every task was billed against a plan, which has no per-request figure |
unpriced |
null |
nothing was priced and something should have been |
no_successes |
null |
nothing passed, so there is no denominator |
The same aggregates, narrowed to the summary’s range, are the routing block of
--summary-json — beside the usage they are about, which is where an LLM agent reads them (see
agent-guide.md).
Export as CSV:
ai-usage-tui --routing-csv routing.csv
One row per aggregate. CSV columns:
agent,model,provider,tasks,tokens,cost,retries,escalations,test_passes,
test_failures,review_defects,priced_tasks,unpriced_tasks,quota_tasks,free_tasks,
retries_observed,escalations_observed,review_defects_observed
retries, escalations and review_defects are empty, not 0, when no task reported one;
the three _observed columns say how many did.
TUI Routing View
t toggles the routing panel. Esc (like q) quits the app; it does not return to the
dashboard. The panel has two blocks:
- ROUTING — cost per delivered result: one row per agent/model/provider, sorted cheapest per
passing test first. Columns:
AGENT, MODEL, $/SUCCESS, PASS, RETRY, ESC, DEFECT,
TOKENS, TASKS. A row with nothing passing sorts last and shows —, never $0.00; a rate
no task reported shows —, never 0%, and sorts to the end in either direction.
- ESCALATIONS — derived from sessions: the derived block described above. Drawn only when
there is at least one session to report.
Aggregation
Events are grouped by agent, model and provider (routing::aggregate, src/routing.rs). Each
aggregate carries:
-
tasks: number of events
-
tokens: sum of tokens
-
cost: spend on the tasks that carried a price. A floor, not a total. Read it with the
four counters below, exactly as Transition::cost_after is read with unpriced_after and
quota_after
-
priced_tasks, unpriced_tasks, quota_tasks, free_tasks: which of the four an event
contributed to, classified from its cost_status
An event without a price used to contribute 0 to cost. That made an unpriced or
subscription-billed model divide to $0.0000 per success — and because the panel sorts by that
figure ascending by default, such a model ranked as the cheapest work on the machine and
rendered green as free. On a Max or Pro account that is where all of the Opus work lands
-
retries, escalations, review_defects: an ObservedCount each — the sum over the tasks
that reported one, how many tasks did (observed), and how many of those reported a count
above zero (affected). They were bare sums, so an emitter that never reported one and an
agent that never needed one both read 0%; test_passes/test_failures had always carried
their denominator, and these now do too, once, rather than as three more copies of that guard
-
test_passes, test_failures: events with test_result true / false
cost_per_success is cost / test_passes, and the panel renders what that figure is standing
on rather than the figure alone. The vocabulary is ESCALATIONS’, deliberately — a reader who
has learned it two panels up should not have to learn a second dialect:
| Cell |
Means |
$0.4200 |
every contributing task was priced |
$0.4200+q |
priced, plus some work billed against a plan |
on quota |
all of it billed against a plan: real spend, no per-request figure |
≥ $0.4200 |
some task should carry a price and does not, so this is a floor |
unpriced |
nothing was priced; a floor of $0.0000 would be true and say nothing |
free |
every contributing task was genuinely free or local |
— |
nothing passed, so there is no denominator |
Only $x and free are points on a scale, so only those two sort; the rest are held at the end
of the $/SUCCESS ordering in both directions, the way an unknown row cost is in the model table.
The JSON export adds retry_rate, escalation_rate and defect_rate — each the share of
tasks that reported the count and had one, in percent, so none can exceed 100% (retries / tasks could: one task that retried three times was 300%) — with retries_observed,
escalations_observed and review_defects_observed beside them as the denominators. All of
retries, escalations, review_defects and the three rates are null rather than 0 when
no task reported. It also adds cost_per_success (null unless exact or free) and cost_basis
(one of exact, plus_quota, quota, floor, unpriced, free, no_successes), and its
cost is null rather than 0 when nothing was priced. The CSV appends priced_tasks,
unpriced_tasks, quota_tasks, free_tasks and then the three _observed counts after the
existing columns, never between them.
The TUI adds success_rate (passes over observed results) and cost_per_success (cost over
passes); every rate is — when unobserved, never 0, and sorts to the end either way.
Schema
RoutingEvent (src/model.rs), one row per event in the routing_event table:
task            string
phase           string
agent           string
model           string
provider        string
category        LOCAL | FREE | PAID | CLOUD | UNKNOWN
requests        integer, at least 1
tokens          integer — one counter, no input/output split
cost            number | null
cost_status     reported | calculated | estimated | free | local | quota | unavailable
retries         integer | null — null is "not reported", which is not 0
escalations     integer | null
test_result     true | false | null
review_defects  integer | null
created         unix seconds (the timestamp column)
In journals written by v0.9.0 or earlier the three counters were NOT NULL, and an omitted
field was stored as 0. --record-routing rebuilds such a journal’s table in place, once. Rows already there keep their
zeros: that is what was recorded, and rewriting it as unknown would be inventing in the other
direction.
Data Caveats
- Routing events are opt-in; they are only recorded when explicitly sent via
--record-routing.
- No prompt or completion content is stored.
- Cost is optional. An event without one is counted in
unpriced_tasks and contributes nothing
to cost, so the aggregate stays a floor rather than quietly gaining a zero.
- Test result is optional; pass rate is calculated only from events that include it. The same
holds for the three counters: a rate is taken over the events that reported one, and an event
that reported nothing is neither a clean run nor a failure.