v1.1.0MIT
ai-usage-tui
Terminal dashboard that measures what each AI coding model actually costs per passing test — routing, escalation and budget analytics across Claude Code, Codex CLI, GitHub Copilot, Gemini CLI, OpenCode and Local models, where an unknown cost stays unknown instead of rendering as $0.00. Live TUI or JSON/CSV.
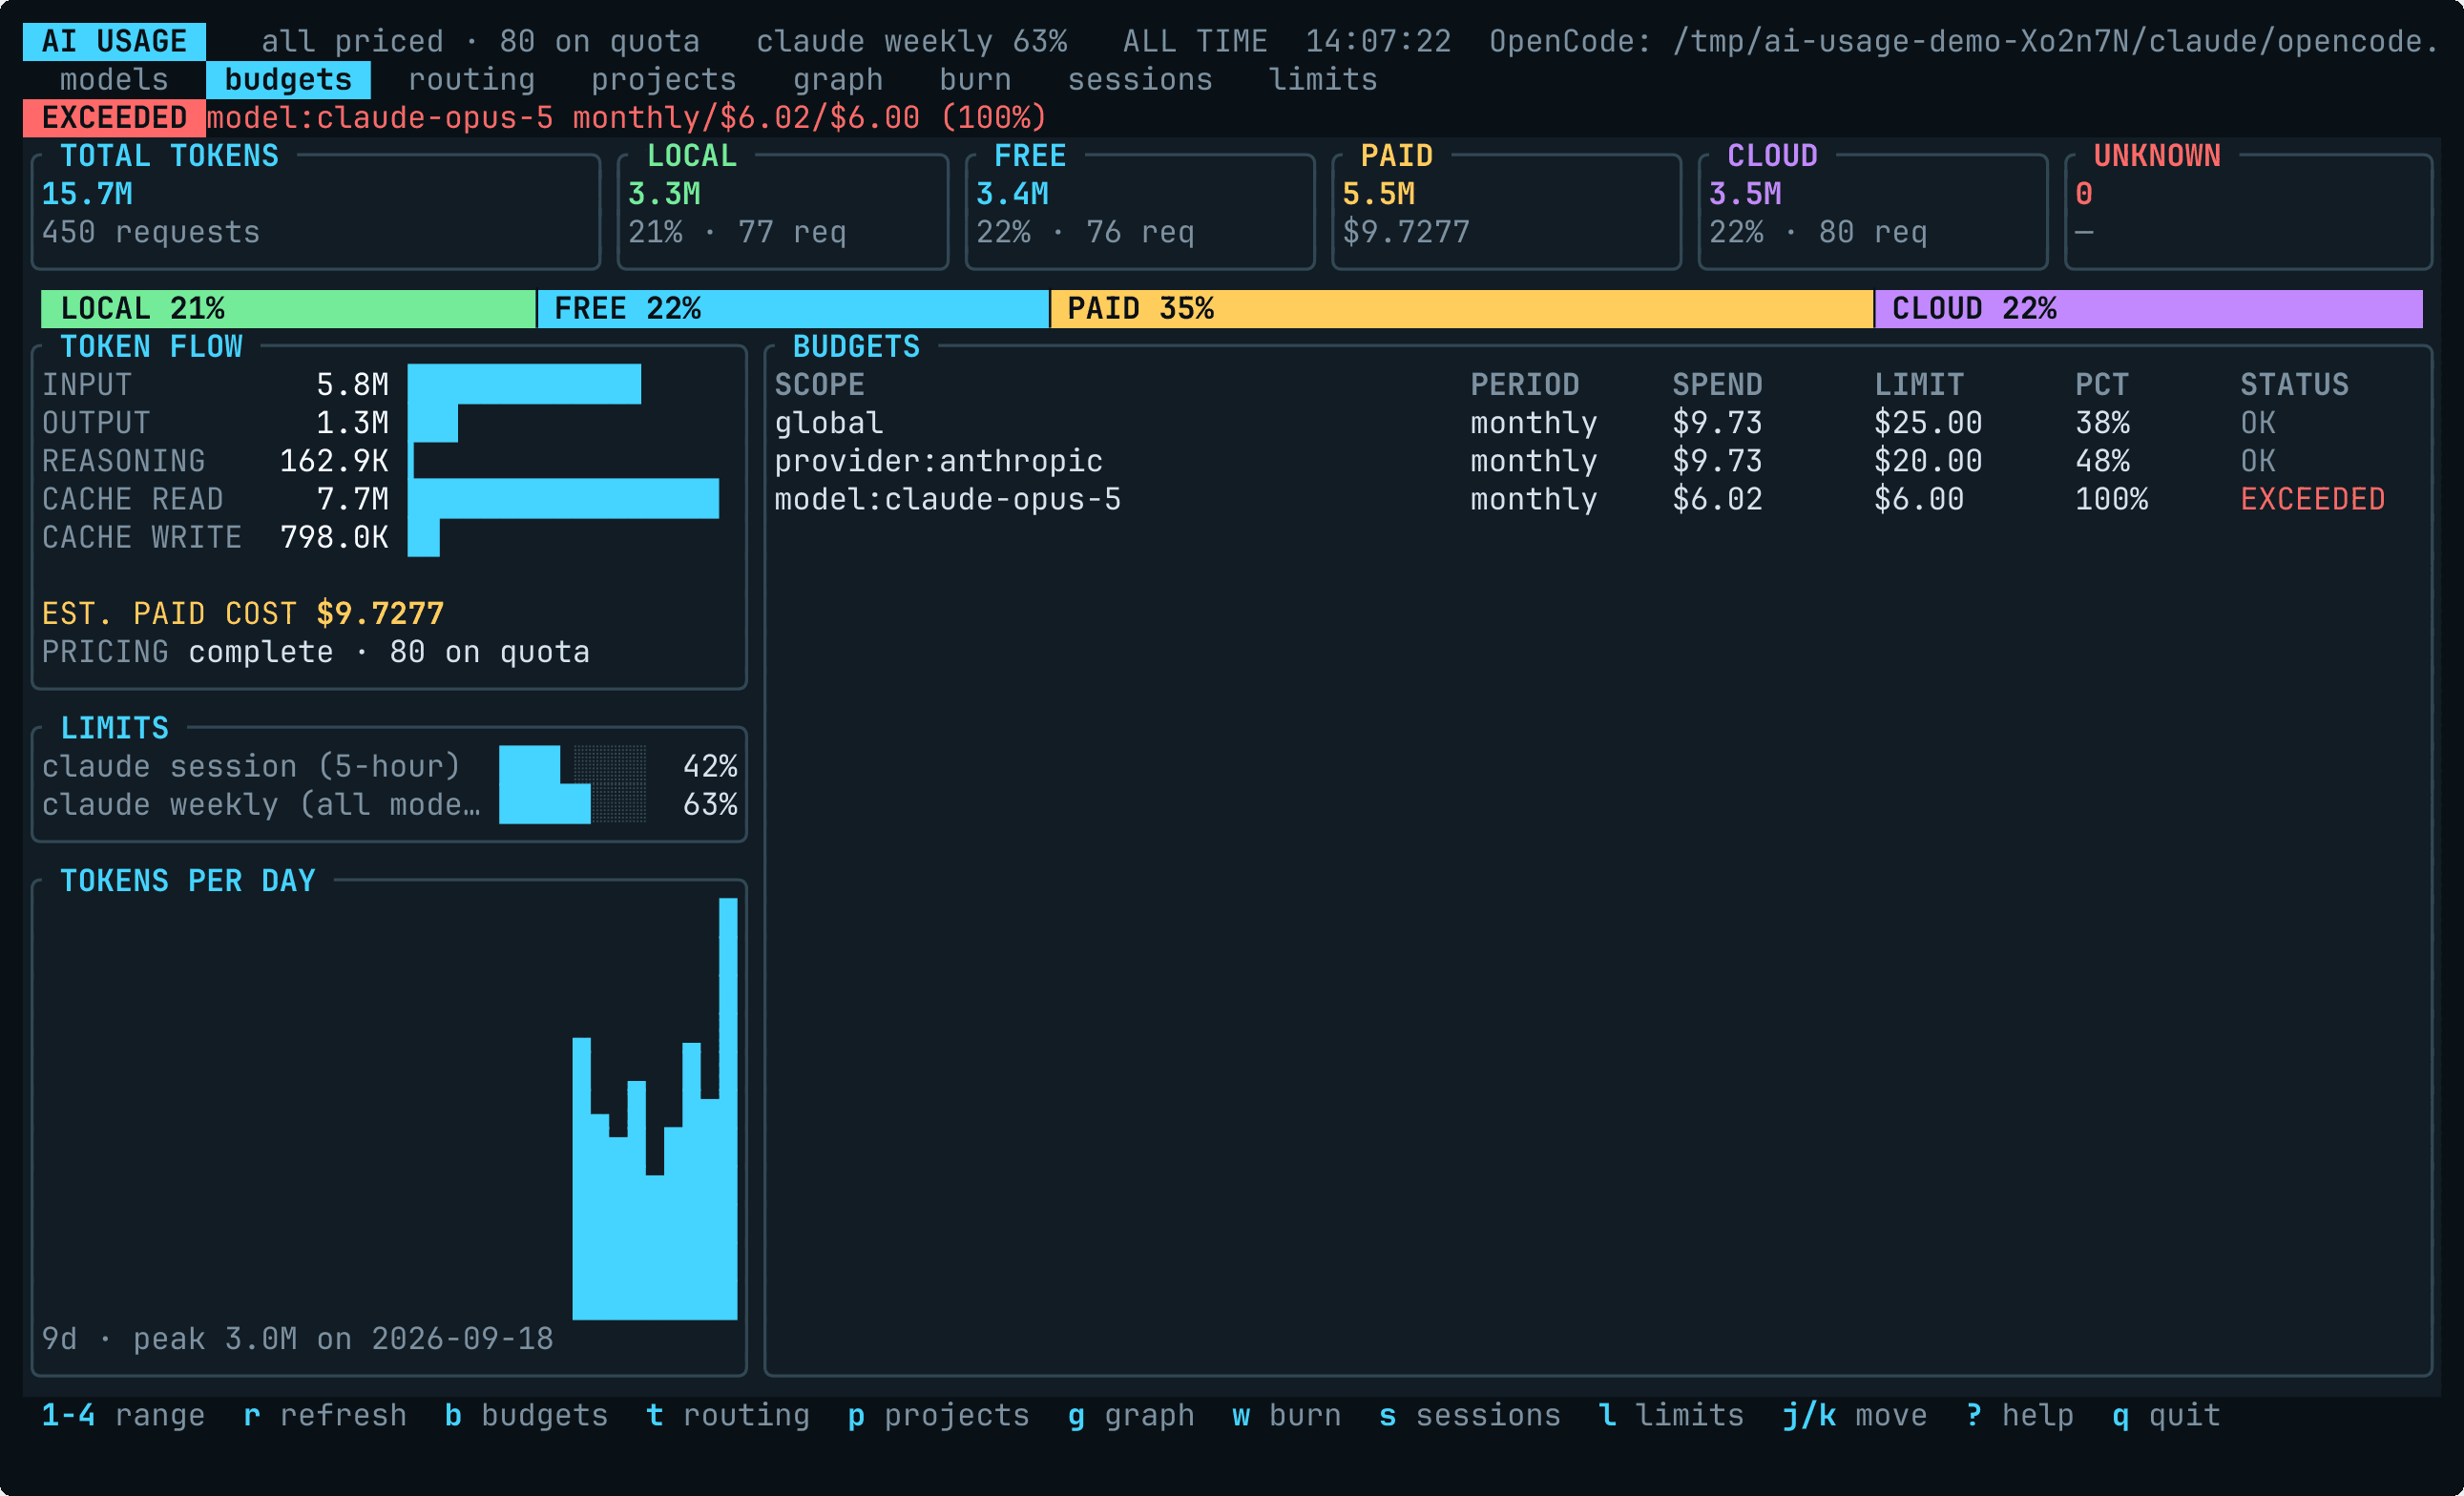
EXCEEDEDmodel:claude-opus-5 monthly/$6.02/$6.00 (100%)
- INPUT
- 5.8M
- OUTPUT
- 1.3M
- REASONING
- 162.9K
- CACHE READ
- 7.7M
- CACHE WRITE
- 798.0K
EST. PAID COST $9.7277
PRICING complete · 80 on quota
- claude session (5-hour)
- 42%
- claude weekly (all models)
- 63%
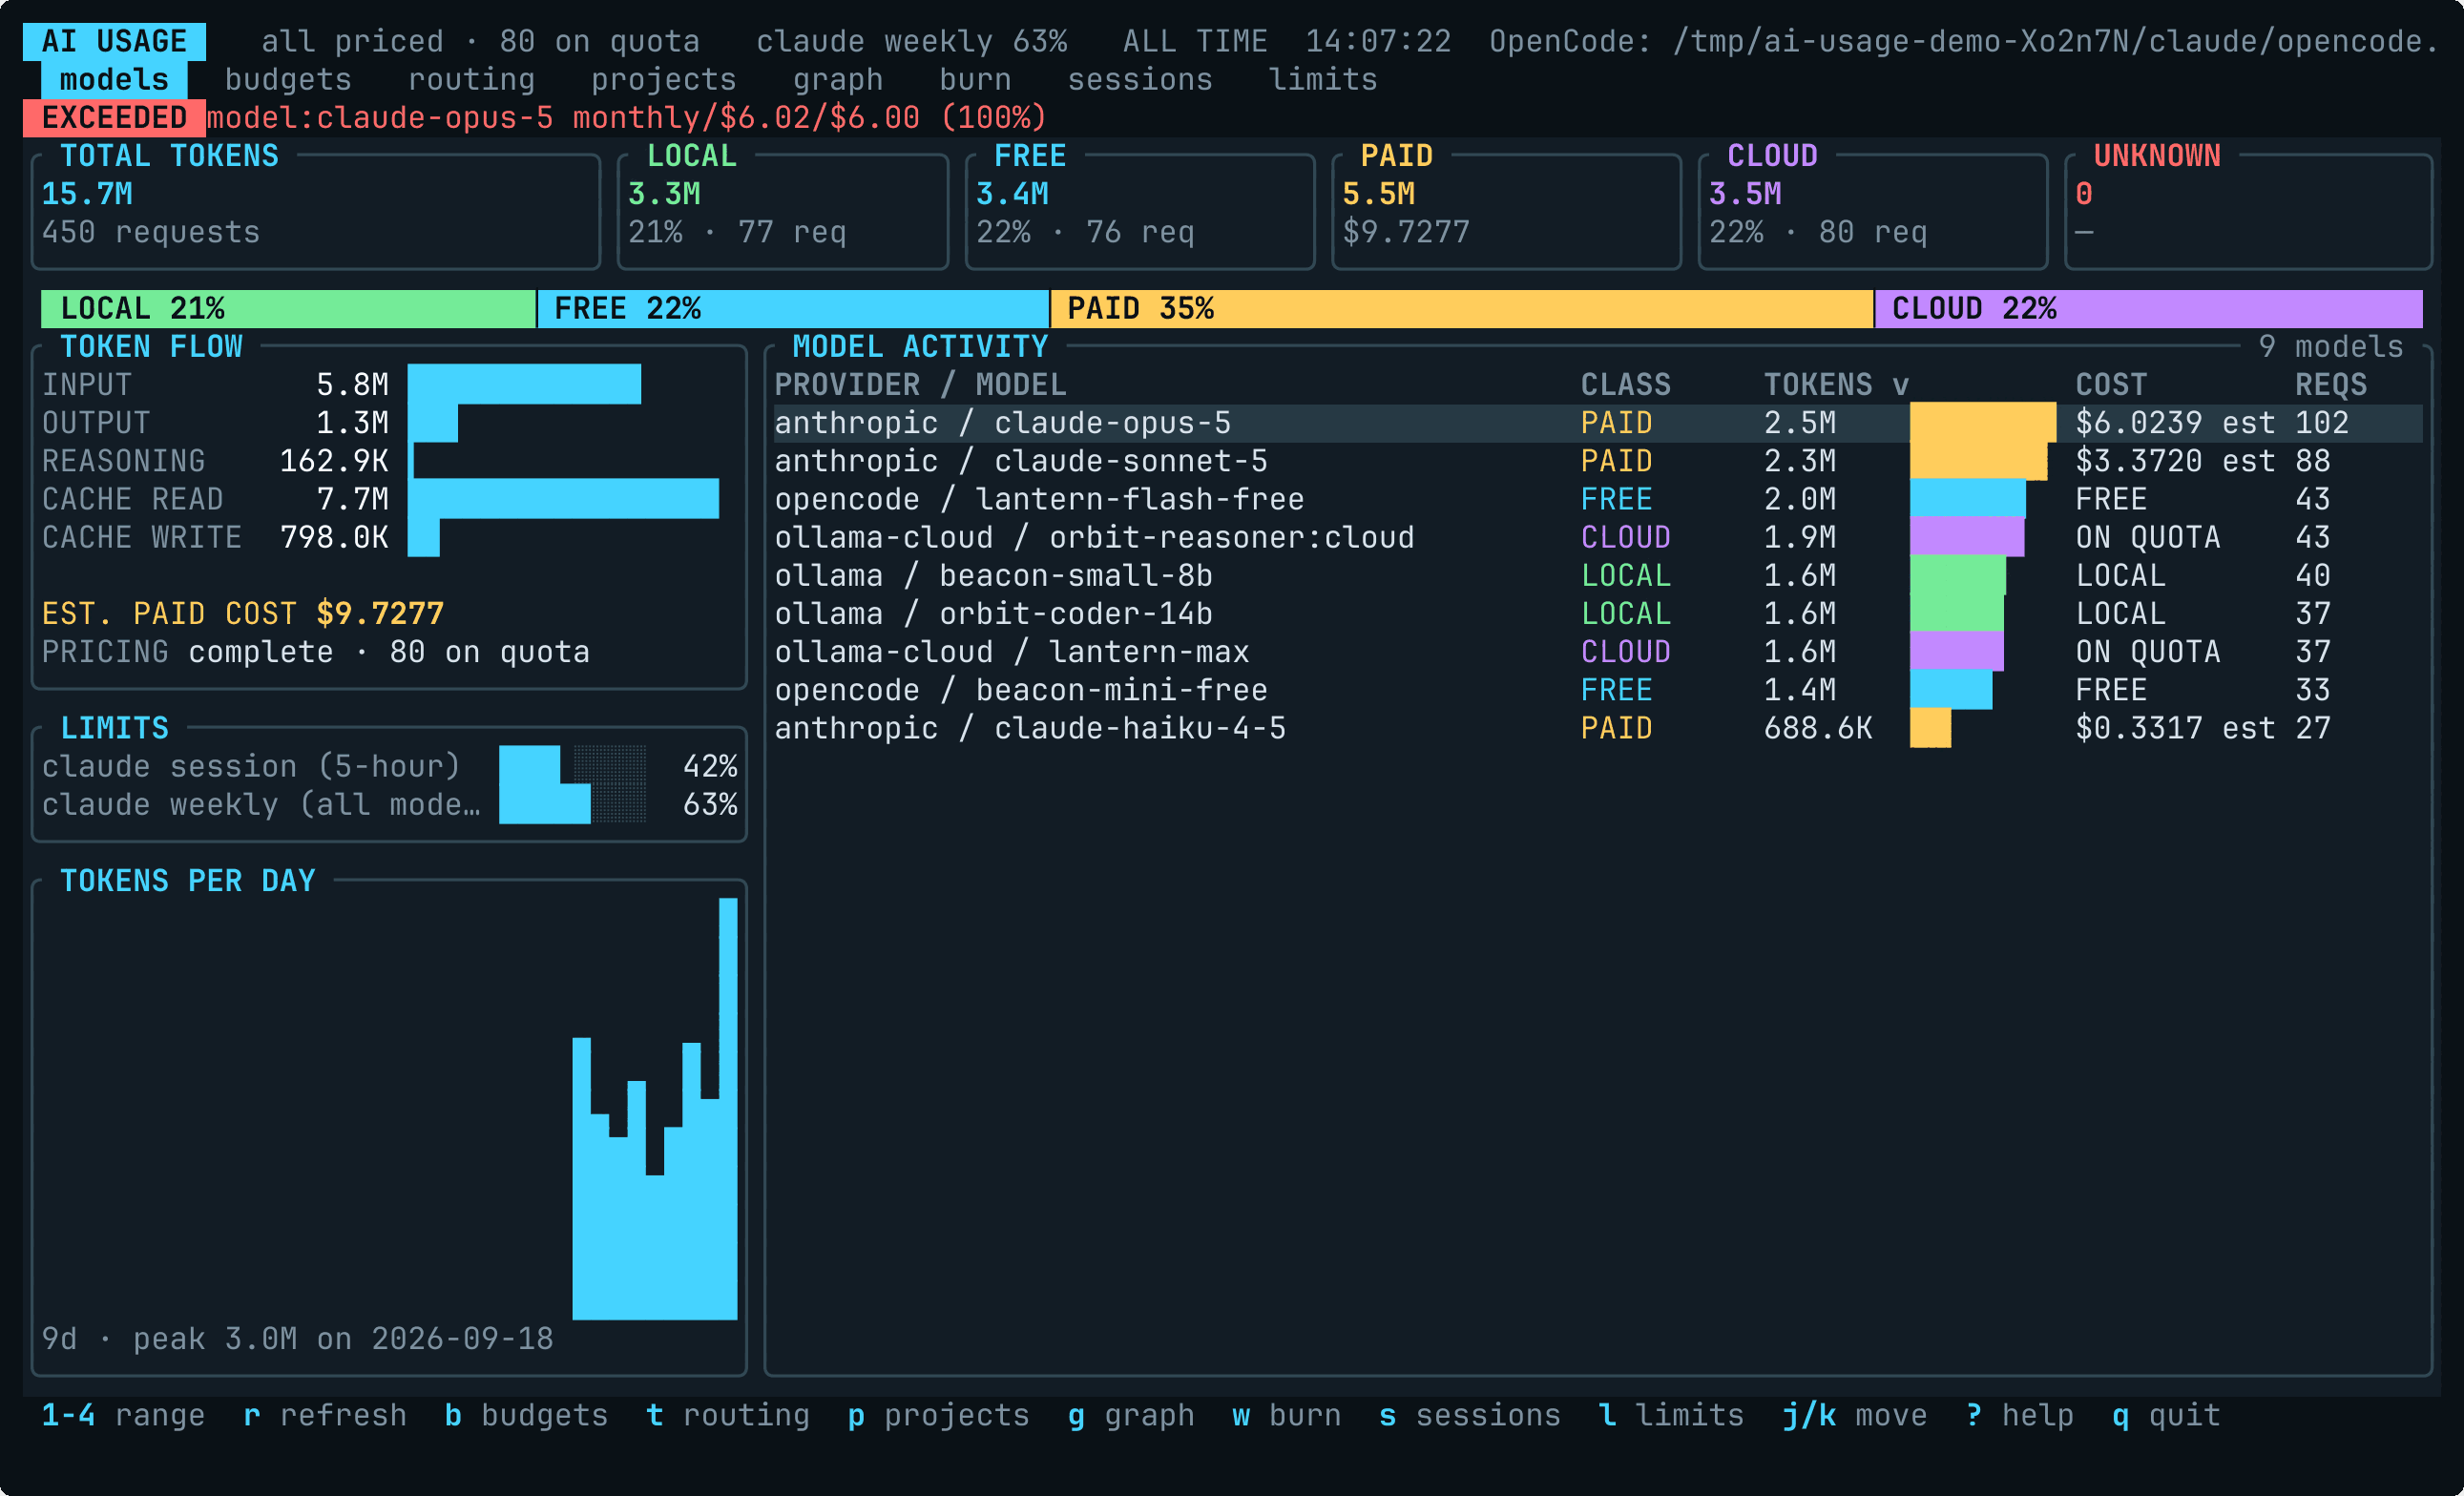
| PROVIDER / MODEL | CLASS | TOKENS | COST | REQS |
|---|---|---|---|---|
| anthropic / claude-opus-5 | PAID | 2.5M | $6.0239 est | 102 |
| anthropic / claude-sonnet-5 | PAID | 2.3M | $3.3720 est | 88 |
| opencode / lantern-flash-free | FREE | 2.0M | FREE | 43 |
| ollama-cloud / orbit-reasoner:cloud | CLOUD | 1.9M | ON QUOTA | 43 |
| ollama / beacon-small-8b | LOCAL | 1.6M | LOCAL | 40 |
| ollama / orbit-coder-14b | LOCAL | 1.6M | LOCAL | 37 |
| ollama-cloud / lantern-max | CLOUD | 1.6M | ON QUOTA | 37 |
| opencode / beacon-mini-free | FREE | 1.4M | FREE | 33 |
| anthropic / claude-haiku-4-5 | PAID | 688.6K | $0.3317 est | 27 |
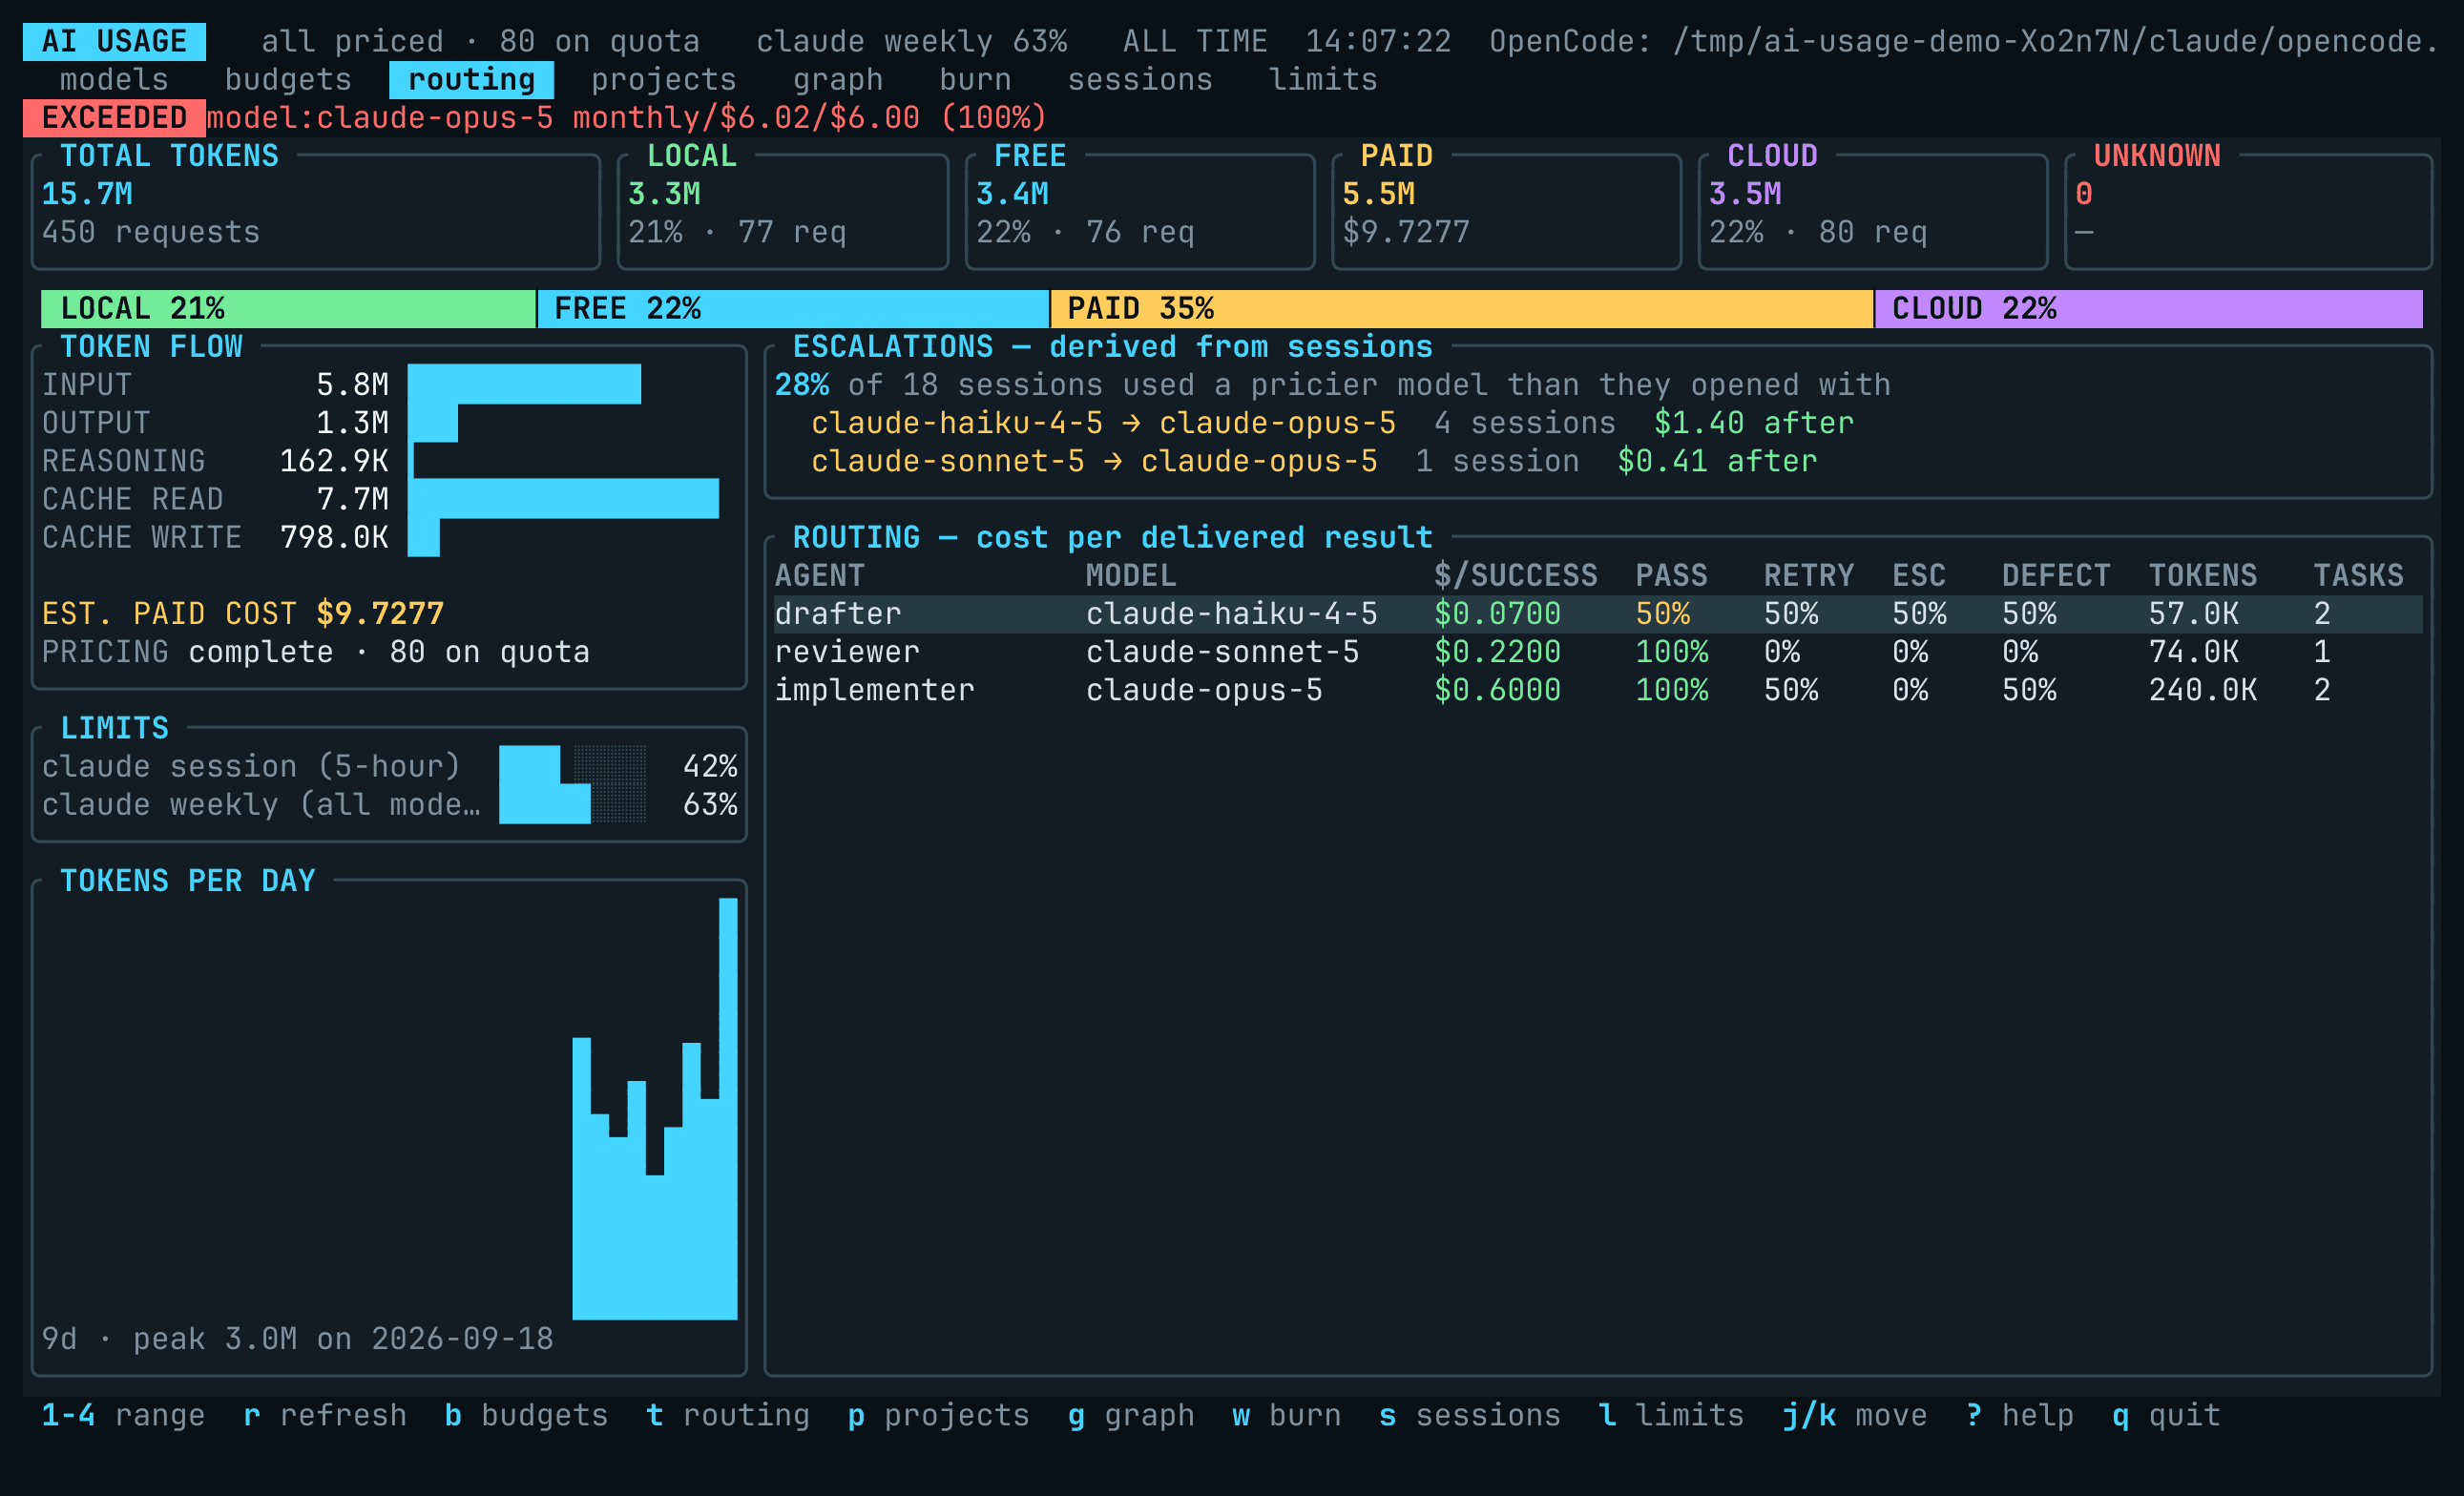
28% of 18 sessions used a pricier model than they opened with
- claude-haiku-4-5 → claude-opus-5 4 sessions $1.40 after
- claude-sonnet-5 → claude-opus-5 1 session $0.41 after
| AGENT | MODEL | $/SUCCESS | PASS | RETRY | ESC | DEFECT | TOKENS | TASKS |
|---|---|---|---|---|---|---|---|---|
| drafter | claude-haiku-4-5 | $0.0700 | 50% | 50% | 50% | 50% | 57.0K | 2 |
| reviewer | claude-sonnet-5 | $0.2200 | 100% | 0% | 0% | 0% | 74.0K | 1 |
| implementer | claude-opus-5 | $0.6000 | 100% | 50% | 0% | 50% | 240.0K | 2 |
| AGENT | WINDOW | USED | RESETS IN | AT | TIER | |
|---|---|---|---|---|---|---|
| claude | Session (5-hour) | 42% | 2h 08m | Fri 13:35 | ||
| claude | Weekly (all models) | 63% | 3d 3h | Mon 15:25 |
Claude Code · updated <1m ago
- tokens/min
- 13.2K
- requests
- 20
- spend
- $0.99/hr
- global monthly
- 15h 29m left ($15.27 remaining)
- provider:anthropic monthly
- 10h 25m left ($10.27 remaining)
- model:claude-opus-5 monthly
- already over
- Live TUI or JSON/CSV
- Everything is read locally, in place.
- No account, no telemetry
- Linux and macOS (x86_64 and aarch64) and Windows x86_64
Install
curl -fsSL https://raw.githubusercontent.com/SophanaSok/ai-usage-tui/main/scripts/install.sh | shbrew install sophanasok/tap/ai-usage-tuiscoop bucket add sophanasok https://github.com/SophanaSok/scoop-bucketscoop install ai-usage-tuicargo install ai-usage-tui --lockedcargo binstall ai-usage-tuiAlso on the release page as prebuilt binaries, .deb and .rpm packages, a PKGBUILD and a Chocolatey package.
Privacy and network behavior
- OpenCode data is read locally from SQLite in read-only mode.
- The local-model journal (
--record-ollama,--record-usage,--record-event) stores usage metadata, not prompt or response content.--record-eventalso stores the project path and session id, when the adapter sends them. - Routing events contain only the JSON fields supplied by the caller.
- An LLM agent you point at the tool (
--summary-json, the Claude Code skill) reads token counts, model names, costs, project paths and session ids. Those travel to the model provider that agent runs on, as anything in its context does — that is your agent’s data flow, not this tool’s, which still transmits nothing. Nothing from your prompts or transcripts is in any export. - Prompts, completions, API keys, credentials, and interaction content are not collected.
- Claude Code session transcripts contain source code and secrets; only the
usageblock of each line is parsed. A test plants a fake credential in a transcript and fails if it reaches a usage record. ~/.claude.jsonis read to decide billing — only whetheroauthAccountis present and itsuserRateLimitTier/organizationRateLimitTierstrings — and for the cached rate-limit windows undercachedUsageUtilization, as the Subscription limits section itemises. The file also holds the account’s email, name, organisation, and per-project prompt history; none of that is retained or logged, and the parsed document is dropped at once..credentials.jsonandsettings.jsonare never read.--statuslinereads Claude Code’s statusline payload from stdin, and from it only the threerate_limitswindows’used_percentageandresets_at. The session id, transcript path, working directory, model and session cost in the same payload are never deserialised. It writes one file in the data directory,statusline-limits.json, holding those figures and the time they arrived, and nothing else. The environment is checked only for the presence ofANTHROPIC_API_KEY,ANTHROPIC_AUTH_TOKEN,CLAUDE_CODE_USE_BEDROCK, andCLAUDE_CODE_USE_VERTEX; their values are not read.- Copilot’s CLI store and session logs contain prompts, completions and tool
arguments in their
turnstable anduser.message/assistant.messagerecords; only theassistant_usage_eventscolumns andsession.shutdownaggregates are parsed, under the same planted-credential test as Claude Code. - Cursor’s
state.vscdbis never opened. See Why there is no Cursor collector. - Codex rollouts contain prompts, tool-call arguments and outputs, and
reasoning summaries; only
session_meta,turn_context, and thetoken_countblock (token counts, and therate_limitswindows beside them) are parsed, under the same planted-credential test as Claude Code.~/.codex/auth.jsonis a credential file and is never opened; the environment is checked only for the presence ofOPENAI_API_KEYandCODEX_API_KEY. - Omarchy’s agents-panel records are read-only display data: six fields per
record (
id,name,updatedAt,ready,tierLabel,usageStatusText,limits). The agents’ credentials, Omarchy’s probe cache, the record’sauthHelpTextand token tallies are never read, no network request is made, and the reader writes nothing into the directory. --omarchy-recordis the one write into Omarchy’s directory, and only that explicit action performs it:<id>.json(opencodeby default) holding token counts, model ids, request and session counts, and budget figures — never content, never a path. Ids that would overwrite Omarchy’s own files (claude,codex,fireworks) are refused; the file is written atomically with mode 0600.- Per-project attribution records the working directory path of each
session, so
~/a/buildand~/b/buildstay separate projects. The dashboard shows only the shortest name that distinguishes them, but--jsonand--csvexport the full path — worth knowing before pasting an export into a ticket. - Normal dashboard and export operation does not require a network request,
and nothing is written outside the tool’s own data directory unless
--omarchy-recordis run. --refresh-pricing,--refresh-zen, and an enabledzen_pricingbackground collector make outbound requests to OpenCode/Zen endpoints.- Two commands ask GitHub for the latest release tag, and nothing else does:
--check-update, whose only job is to ask and cache, and--doctorwhen[update] check = true. Off by default, never automatic, and never on the dashboard’s refresh path. It is a plain GET of a public endpoint: no usage data, no identifiers, no query parameters. The User-Agent names the tool and its version because GitHub’s API requires one. - That answer is cached in the tool’s own data directory, and the dashboard
reads it once at startup to show a newer release in its header. The cache
is what keeps the header offline: it redraws several times a second and never
makes a request or reads a clock. Only those two commands write it, so with
neither run the header stays silent — except for an answer an earlier run
already left, which
--doctordiscloses. - A recurring check is yours to schedule, not the dashboard’s to make:
contrib/systemd/user/ai-usage-update.timerruns--check-updatedaily, and any other scheduler can run the same command. The dashboard process itself never makes the request, whatever the config says. - Reporting how this copy was installed and how to upgrade it needs no
network at all.
--doctorreads it off the running binary’s own path, so it is always on and works offline.
What it shows
- Routing aggregates: cost per passing test, with retries, escalations, and review defects per model
- Derived escalations: which sessions reached for a pricier model, and what it cost afterwards
- A compact summary an LLM can read whole — cache-hit rate, tokens and cost per request, and the model mix by project, session and day — with a shipped Claude Code skill, so you can simply ask how to cut your token usage or whether your routing is earning its cost
- Usage grouped by provider and model, across OpenCode, Claude Code, Codex CLI, GitHub Copilot, Gemini CLI, and Local models
- Input, output, reasoning, cache-read, and cache-write tokens
- Today (local calendar day), trailing 7-day, trailing 30-day, all-time, or custom-day ranges
LOCAL,CLOUD,FREE,PAID, andUNKNOWNclassifications, each with its share of the tokens, and one strip dividing the whole between them- Provider-reported, calculated, estimated, free, local, quota-billed, or unavailable cost
- Daily and monthly budget status
- Subscription rate-limit windows and their resets, from Claude Code’s own cache, from its status
line (
--statusline, which also gives Claude Code a one-line readout), and from Omarchy’s agents panel
| Category | Meaning |
|---|---|
LOCAL |
Usage identified as running on a local endpoint |
CLOUD |
Hosted or cloud-routed usage without authoritative cost |
FREE |
Usage from a model explicitly identified as free |
PAID |
Usage from a provider that bills per token — including aggregators and clouds (OpenRouter, Bedrock, Azure, Vertex). Whether a rate is known is reported separately, below |
UNKNOWN |
Usage whose provider is not recognised as billing per token |
PAID is about who bills, not about whether we have a figure. A paid row with no
published rate keeps cost as unknown and counts against the pricing-coverage
figure, so the gap is visible rather than hidden in UNKNOWN.
Cost status is reported separately from category: reported comes from the
provider, calculated or estimated comes from pricing data, free and
local are non-billable, and unavailable remains unknown.
quota is its own case: the usage is billed, but against an account quota or
GPU time rather than per token, so no per-request price exists to report. Ollama
Cloud is one example; Claude Code on a Pro or Max subscription is the other.
For subscription rows the API-list-rate figure is kept as api_equivalent_cost
and shown as API-RATE EQUIV. in the breakdown, but it is never summed into
cost or budgets. quota is deliberately not counted as a pricing gap —
doing so reported a correct refusal to invent a number as a failure to produce
one — and deliberately not rendered as $0.00. The header shows the volume
alongside the coverage figure so it cannot silently disappear.
Unknown cost is kept unknown rather than displayed as paid usage with a zero cost. Local and explicitly free usage is excluded from budget spend.
Model-routing analytics
was the expensive model worth it
This answers a question a usage total cannot: is the expensive model actually earning its cost on your work? A model that costs 5x more but lands the change on the first try can be the cheaper one. The panel ranks agent/model pairs by cost per delivered result — dollars spent per passing test — alongside the retry, escalation, and review-defect rates behind that figure.
A pair that never reported a test result — or a retry, escalation or defect
count — shows —, not 0%. Never having been measured is not the same as
failing everything, or as never needing a second attempt.
Watch it
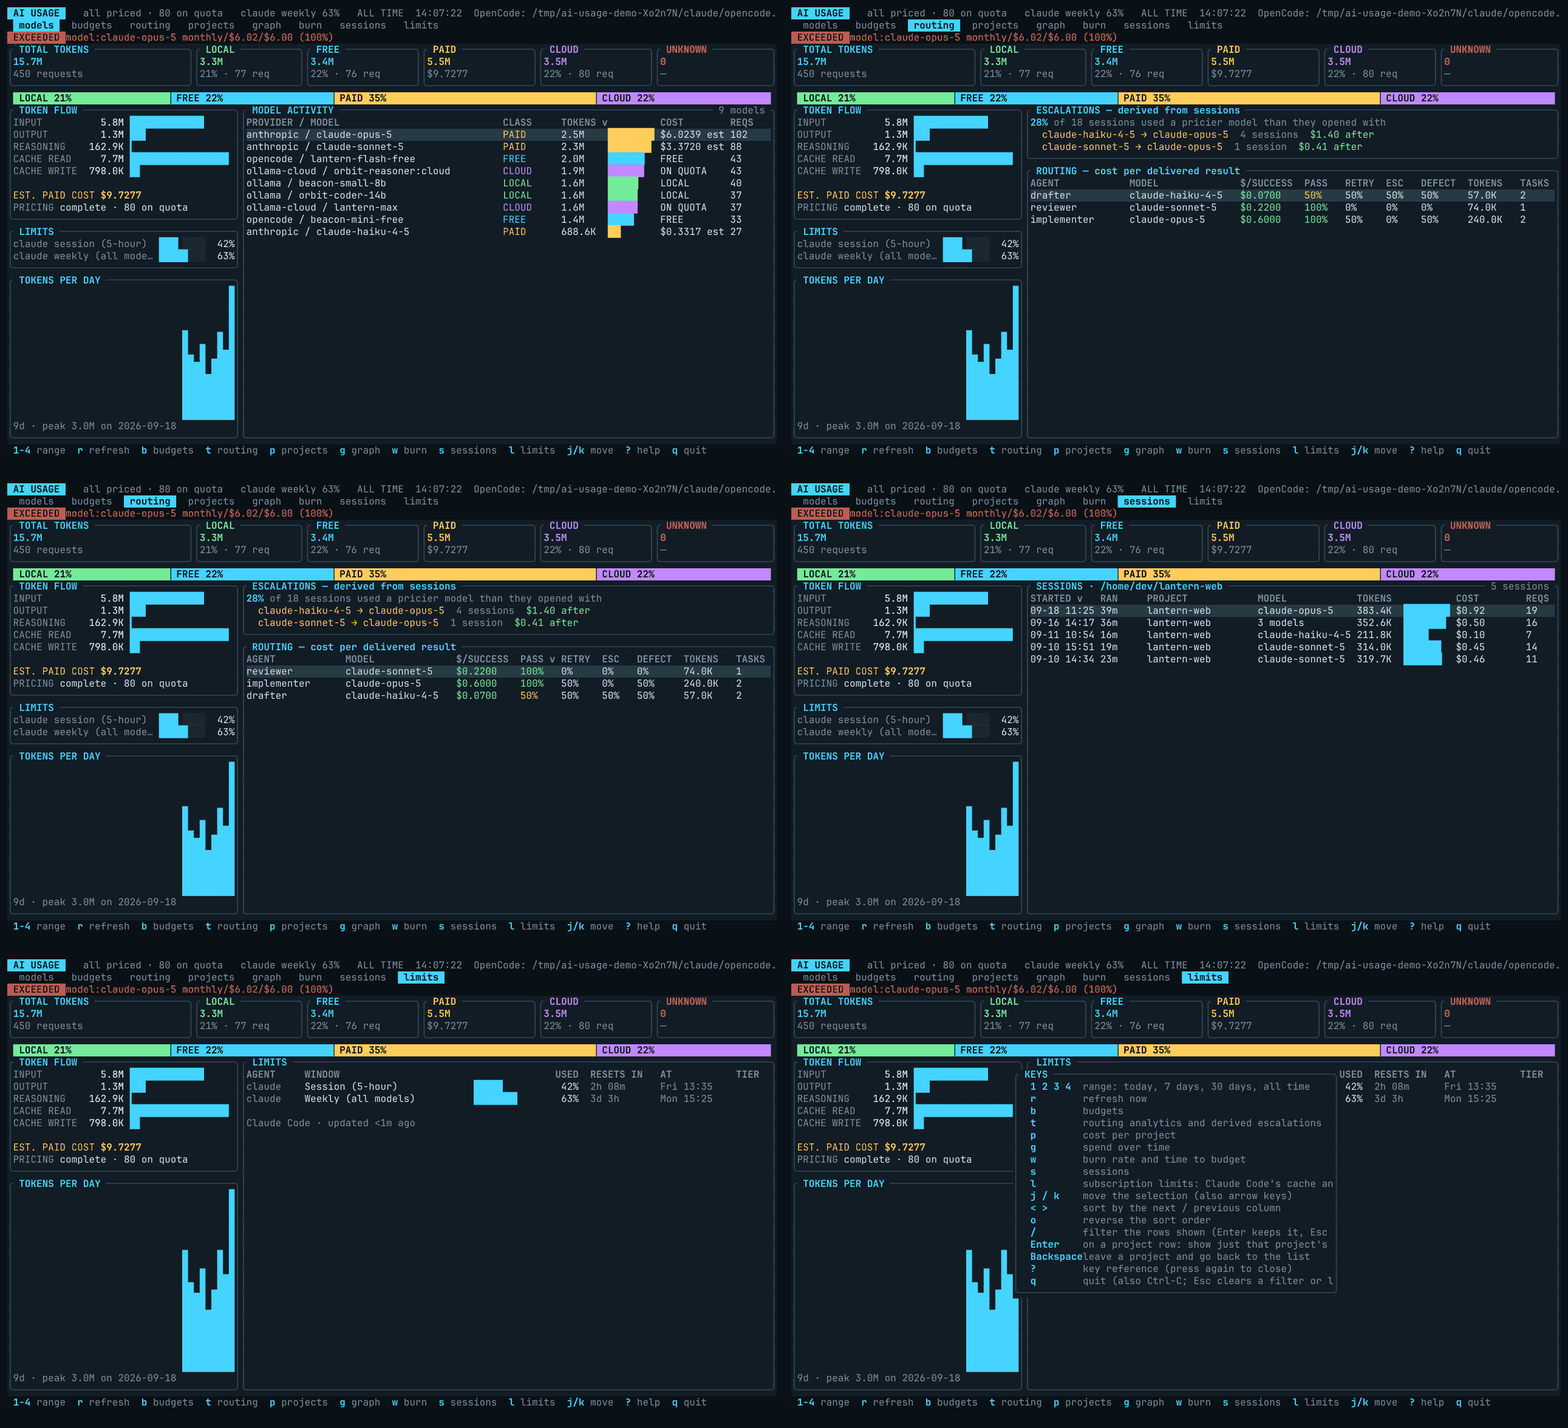
Invented demo data, rendered off-screen by scripts/render-readme-screenshots.sh — the GIF replays a key script through the dashboard’s own dispatch, one frame per key. No real account, project, or spend appears in any image here.
What a Max subscription bought
That is a ratio a reader can form an opinion about — $4.38 of list-rate compute per commit, $8.08 per merged pull request.
Every panel
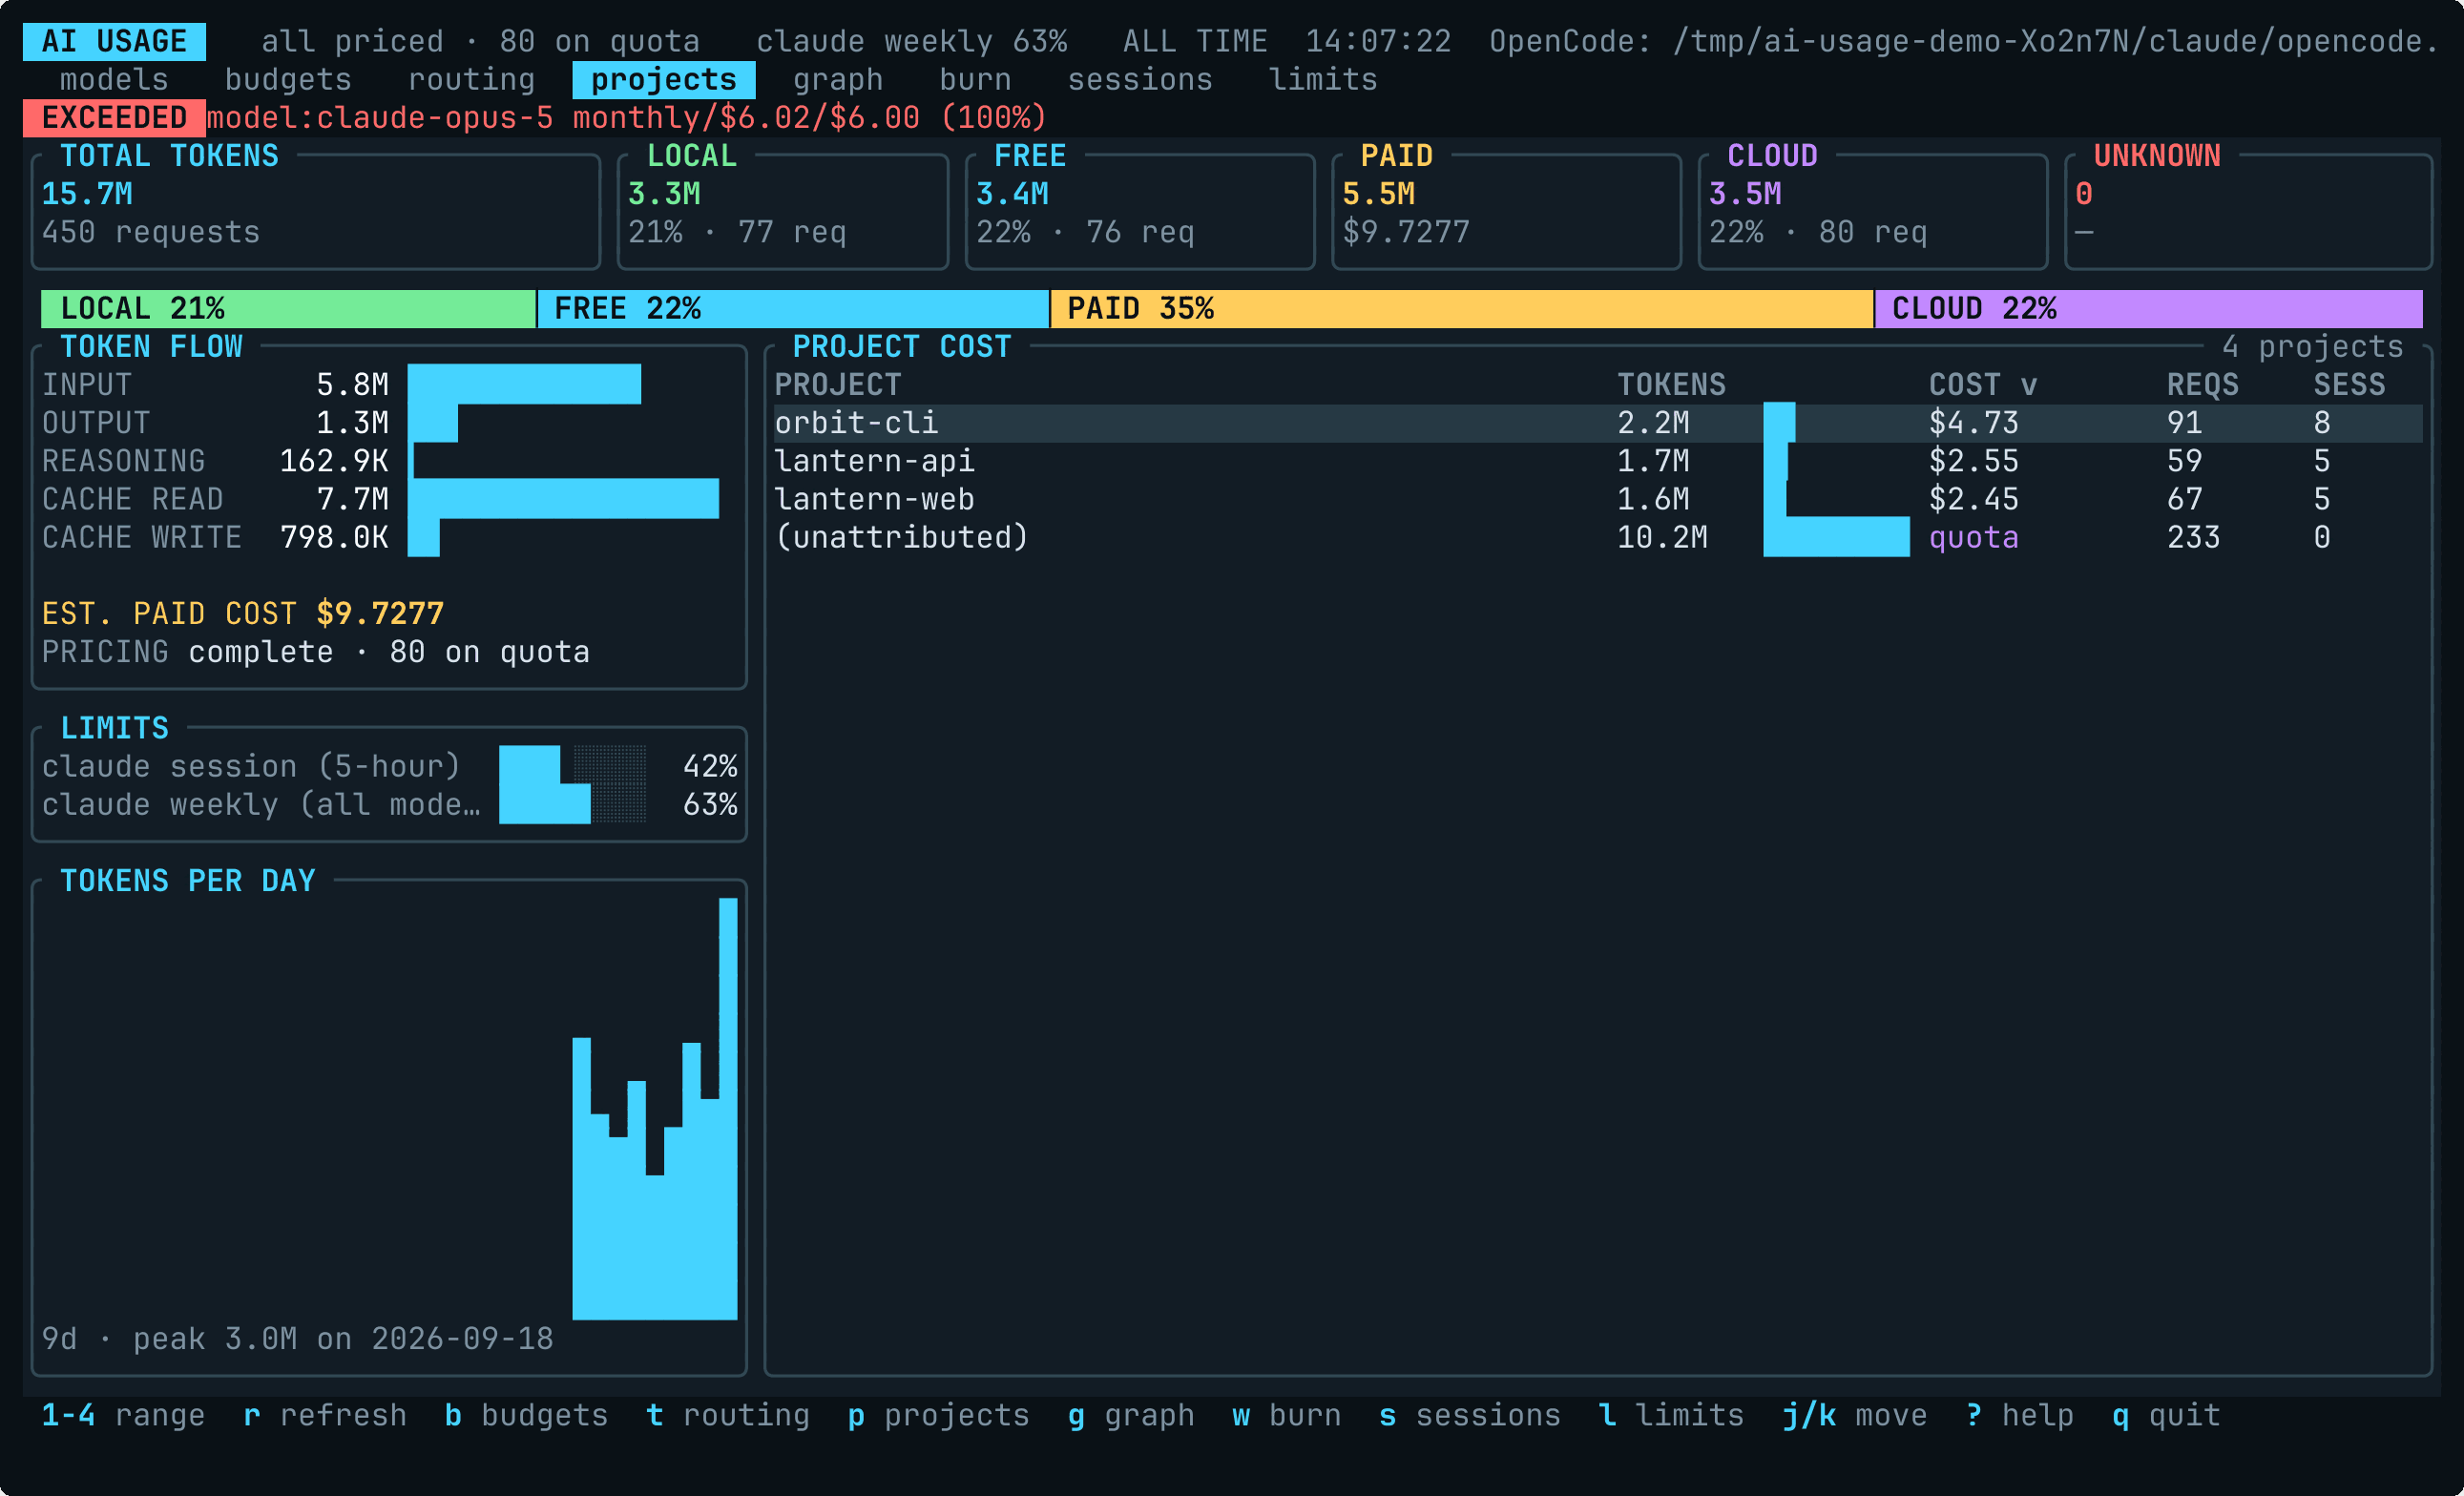
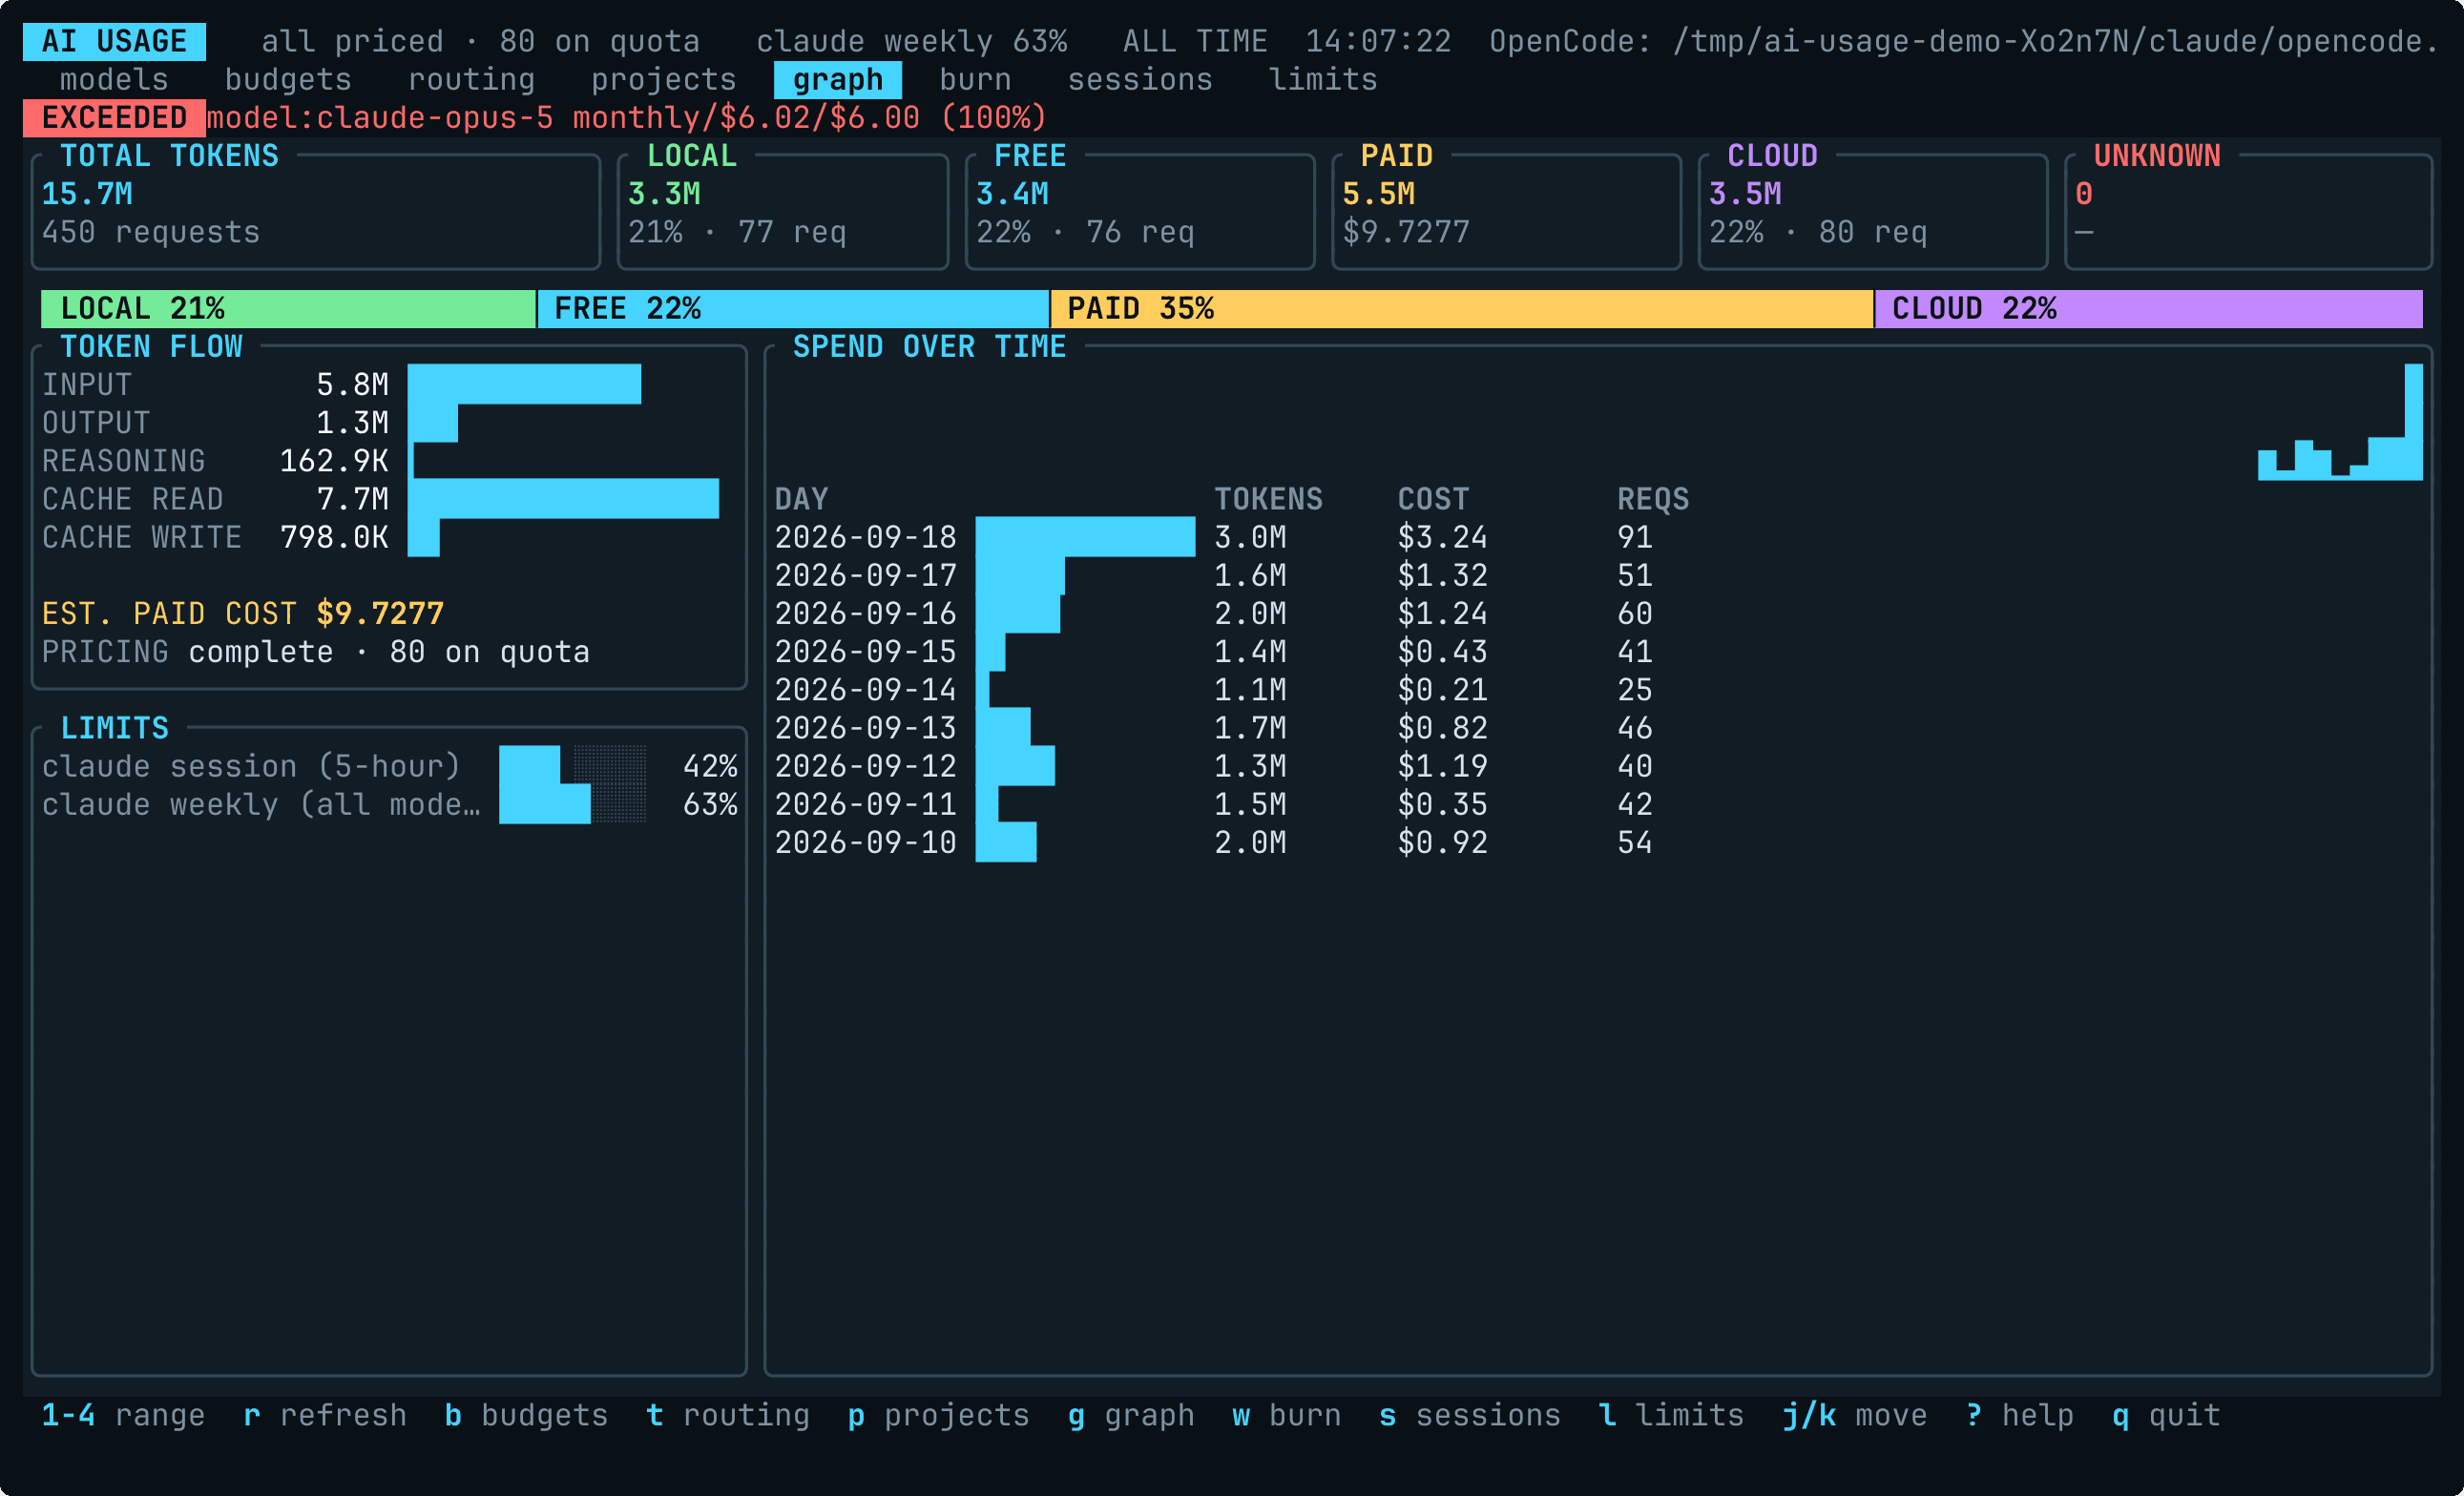
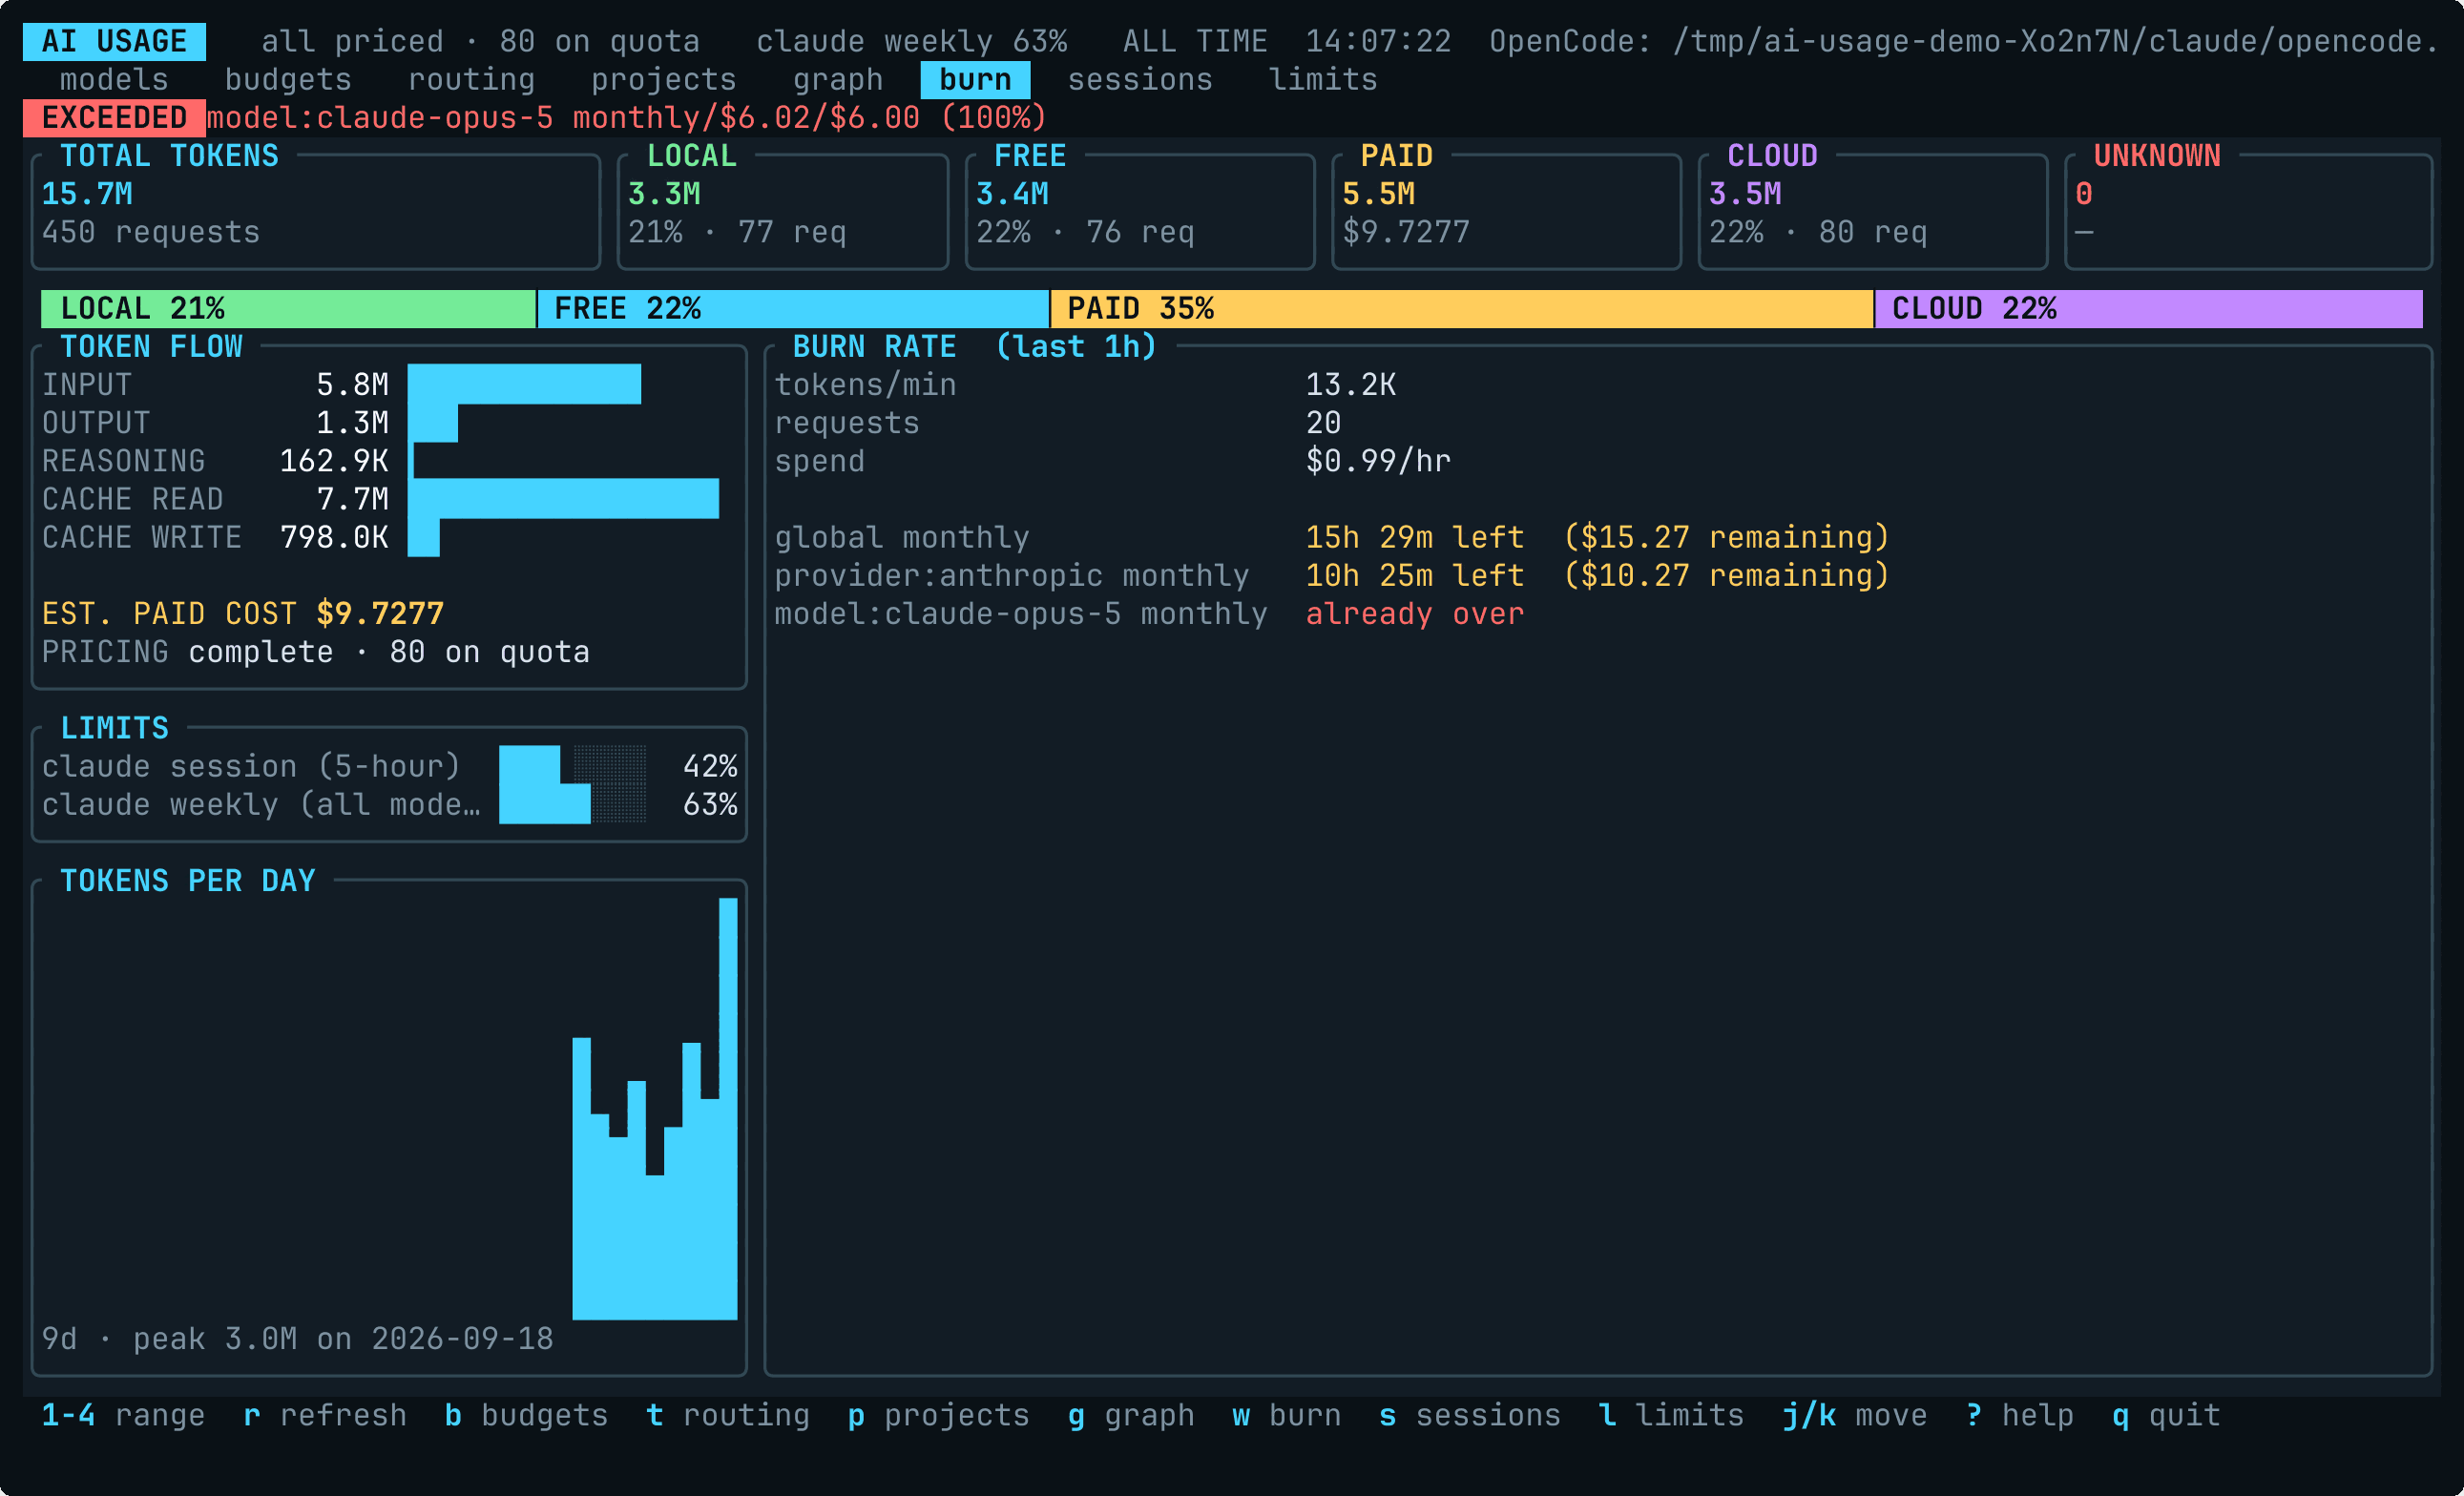
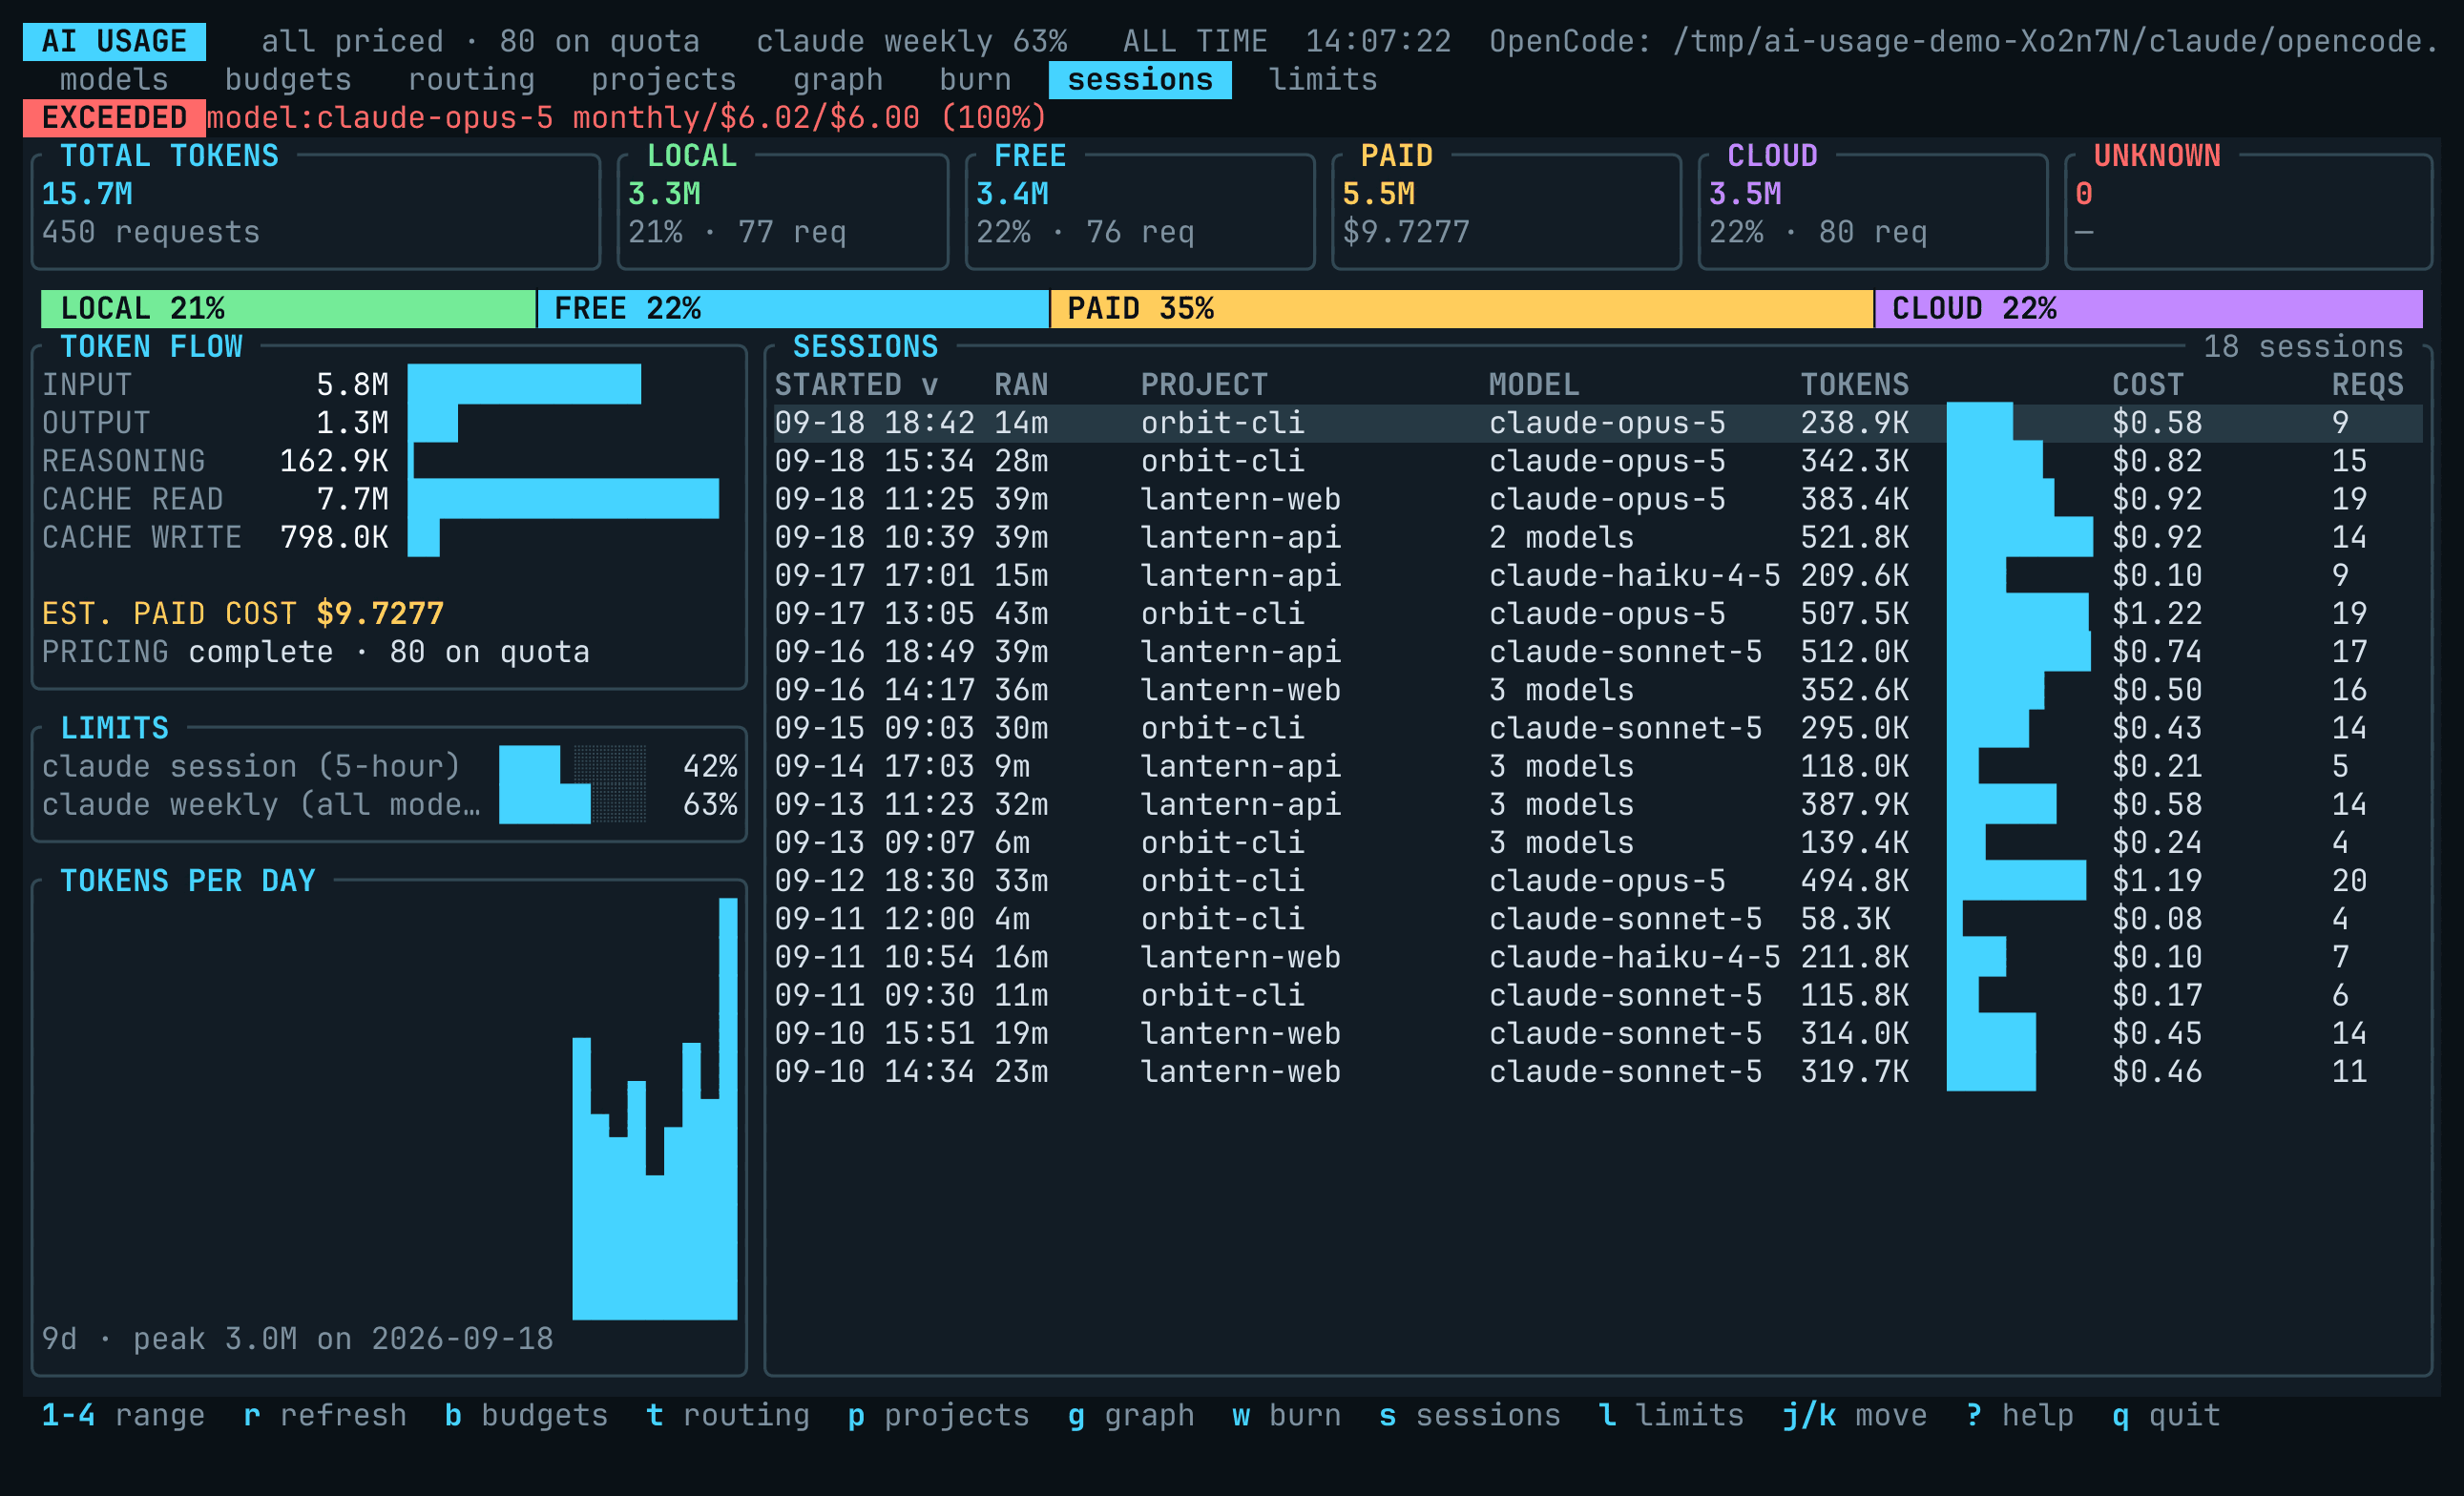
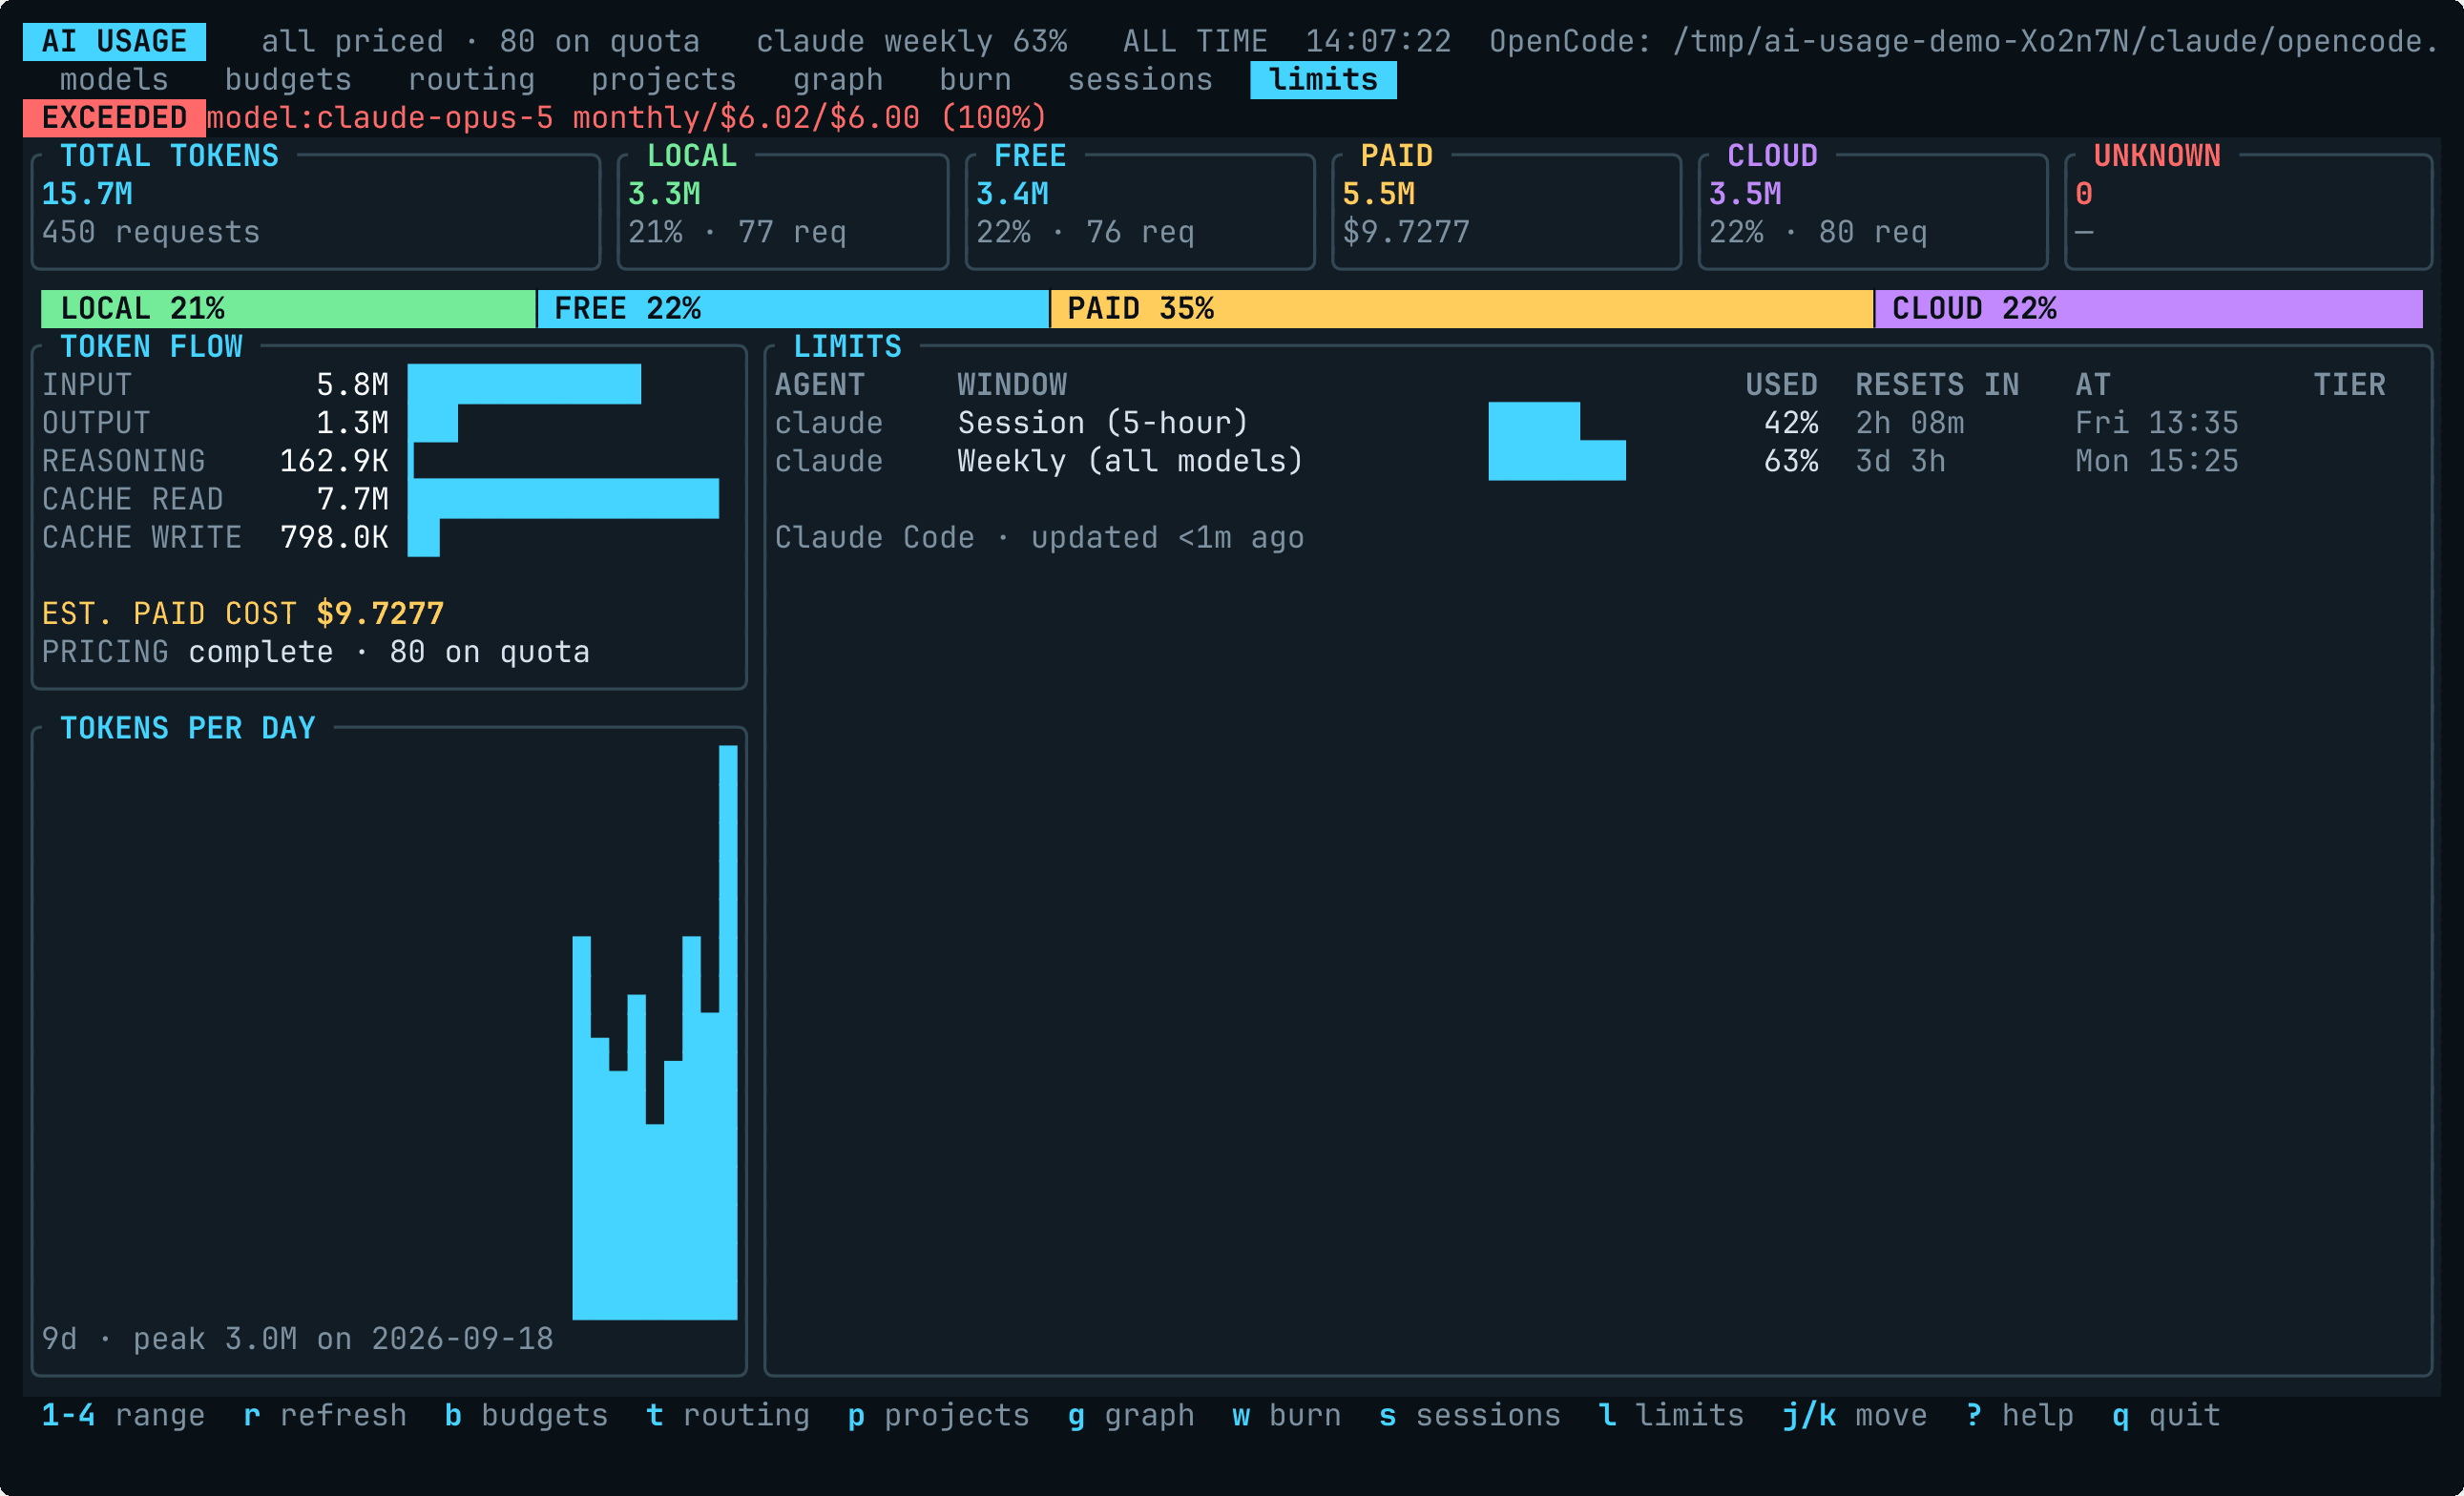
Invented demo data, rendered off-screen by scripts/render-readme-screenshots.sh — the GIF replays a key script through the dashboard’s own dispatch, one frame per key. No real account, project, or spend appears in any image here.
Why there is no Cursor collector
Cursor is the agent most often asked about here, and it is deliberately absent.