The problem
Every usage tool answers “how many tokens did I spend”. Nobody was answering the question that decides whether a subscription is worth renewing: was the expensive model worth it? Two models can burn the same tokens and deliver very different numbers of passing tests, and the difference is invisible in a token count.
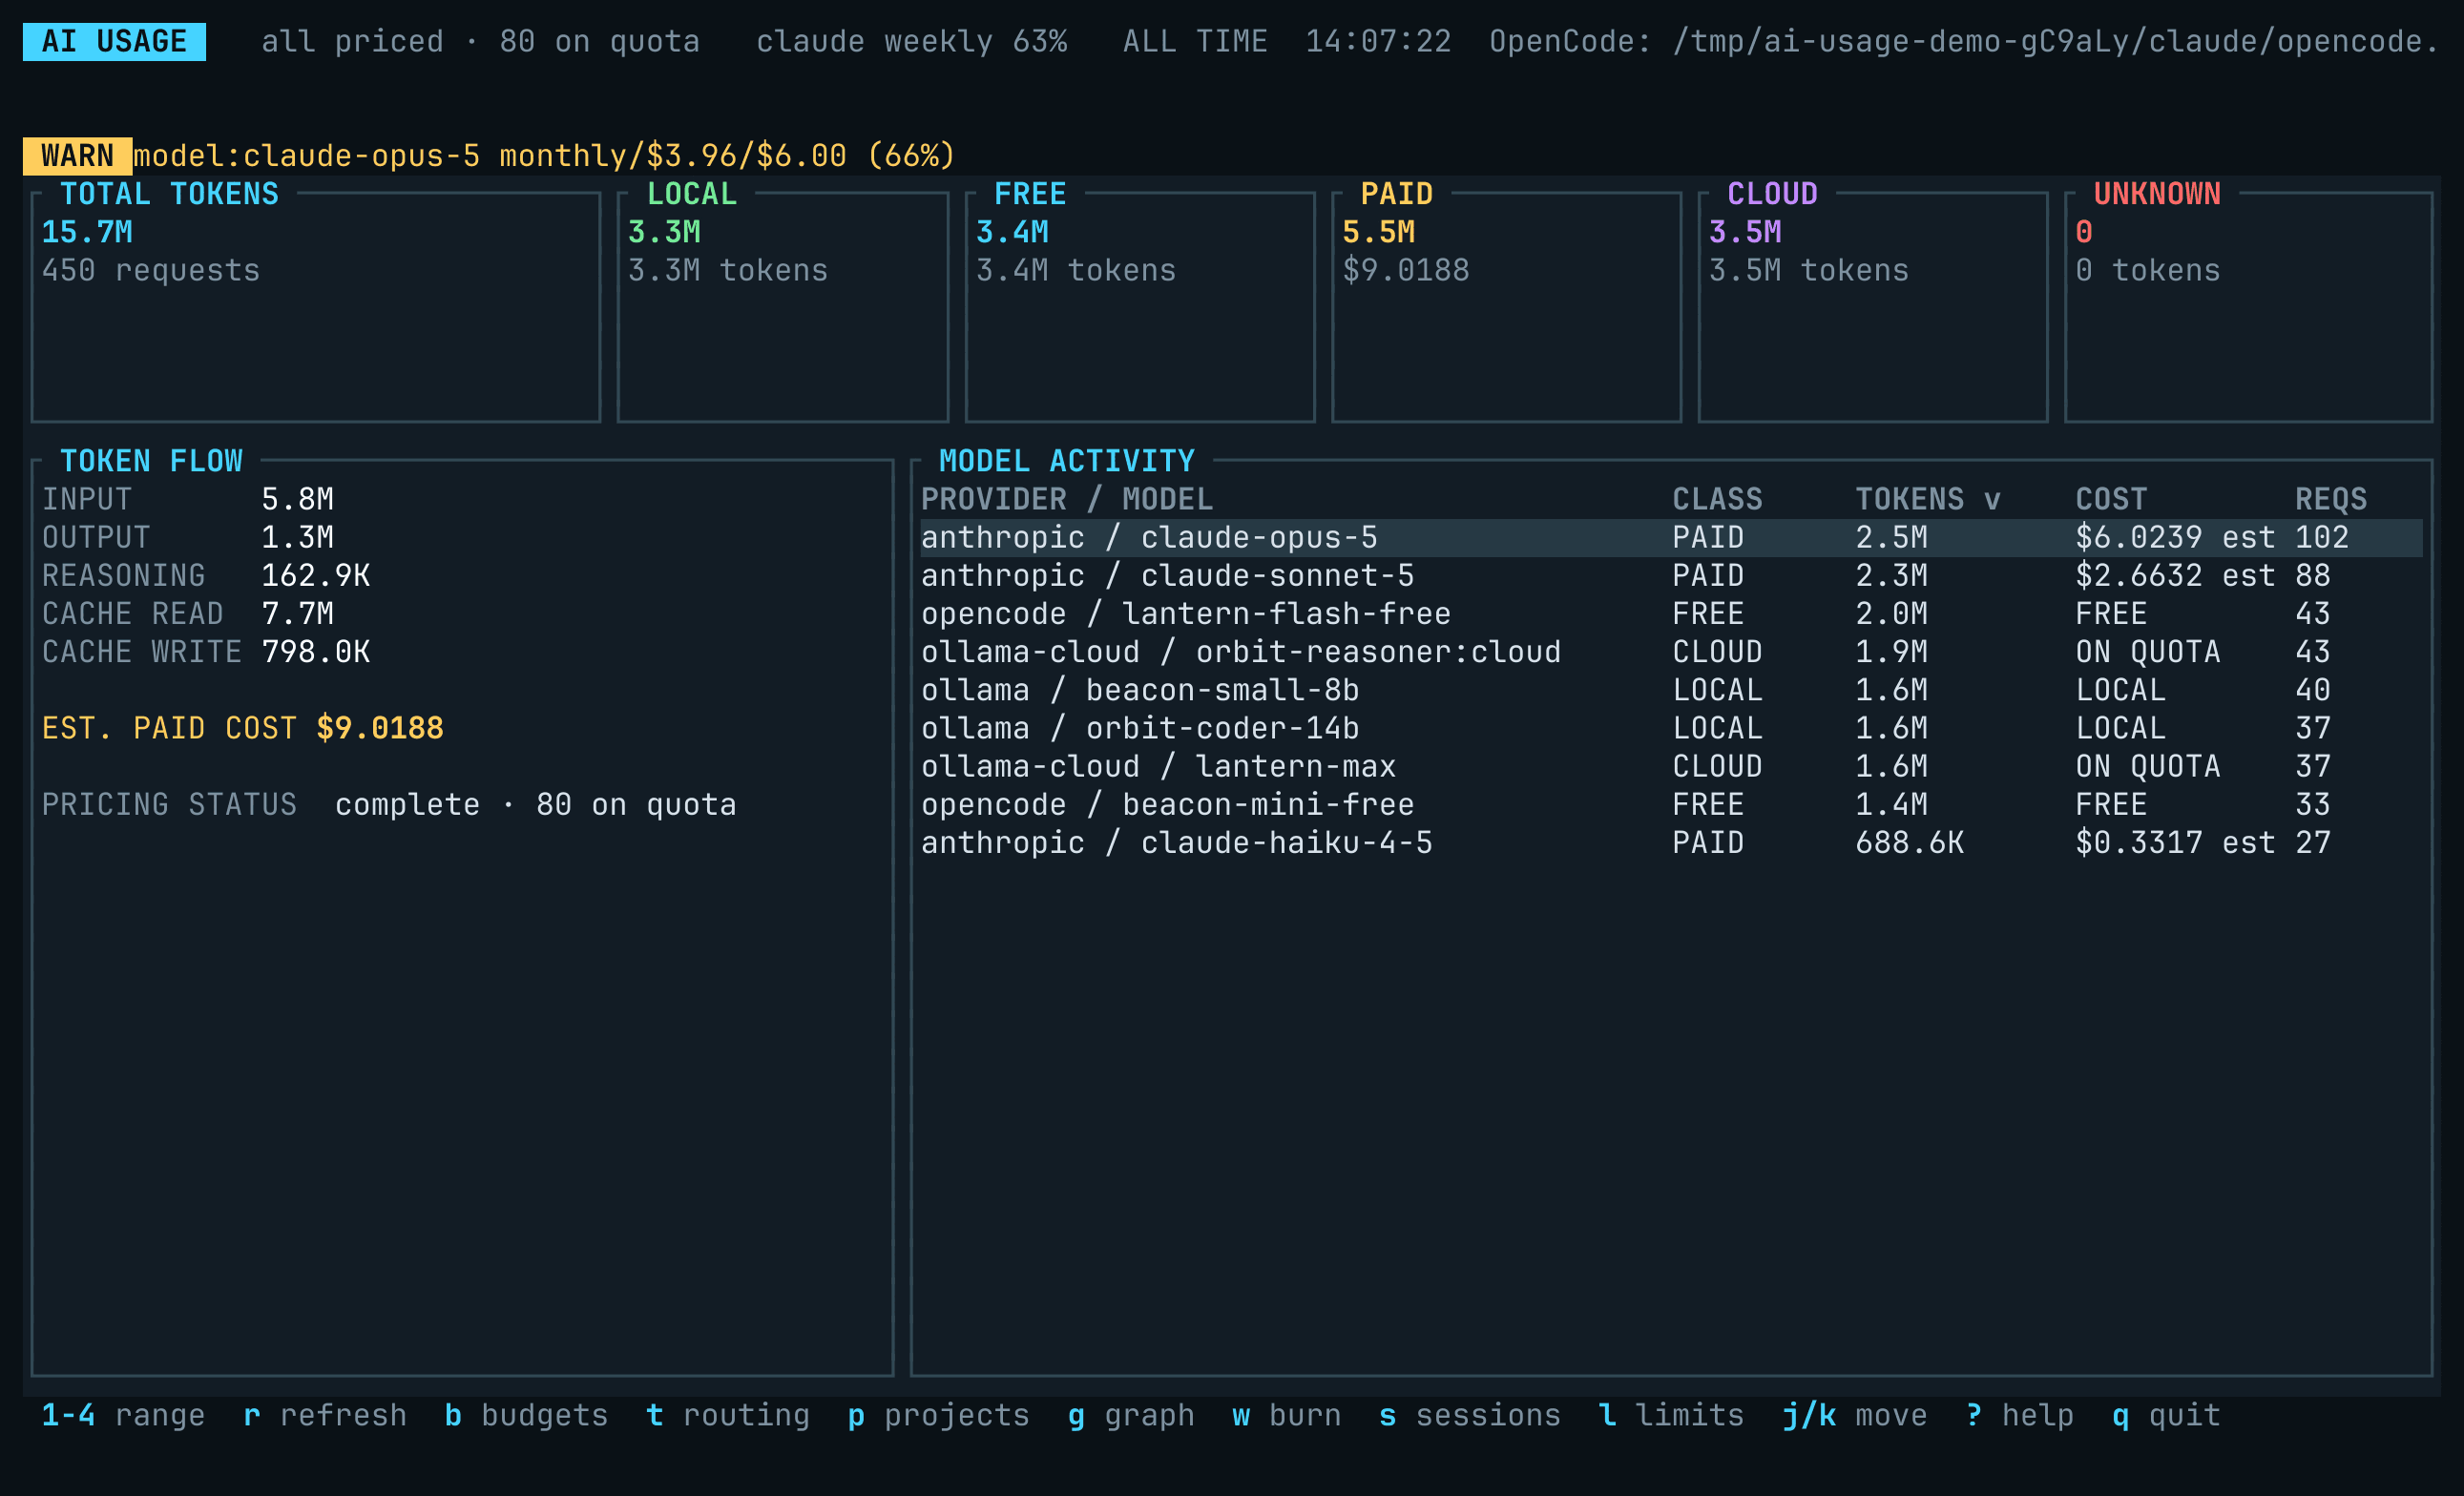
The data to answer it already exists on disk. Claude Code writes session logs, Codex CLI writes rollouts, OpenCode keeps a SQLite database, Copilot and Gemini keep their own stores, and a local Ollama server can journal responses. What was missing was one program that reads all of it, prices it consistently, and joins it to something a person actually cares about.
The design
One registry, two drains. A single list of sources (collector/registry.rs) is iterated by both the background collectors that feed the live dashboard and the one-shot loader behind --json, --csv, budgets and --doctor. This replaced two hand-maintained wirings, where a provider added to one and not the other appeared in the dashboard and was silently missing from every export.
Incremental ingestion. The OpenCode and Copilot collectors resume from a high-water mark; the Claude Code and Codex collectors tail each session log by byte offset. Nothing re-reads history on every poll, and the TUI takes a snapshot on its own refresh interval so collector latency never touches the render path.
Cost provenance. Every cost is labelled provider-reported, calculated, estimated, free, local or unavailable. A rate that is absent from the pricing table is distinct from a rate published as zero, so a paid provider with no published rate yields unavailable, never a cheaper total. The refreshed pricing cache is an overlay on the bundled table, so a lossy refresh can never delete pricing that shipped in the binary.
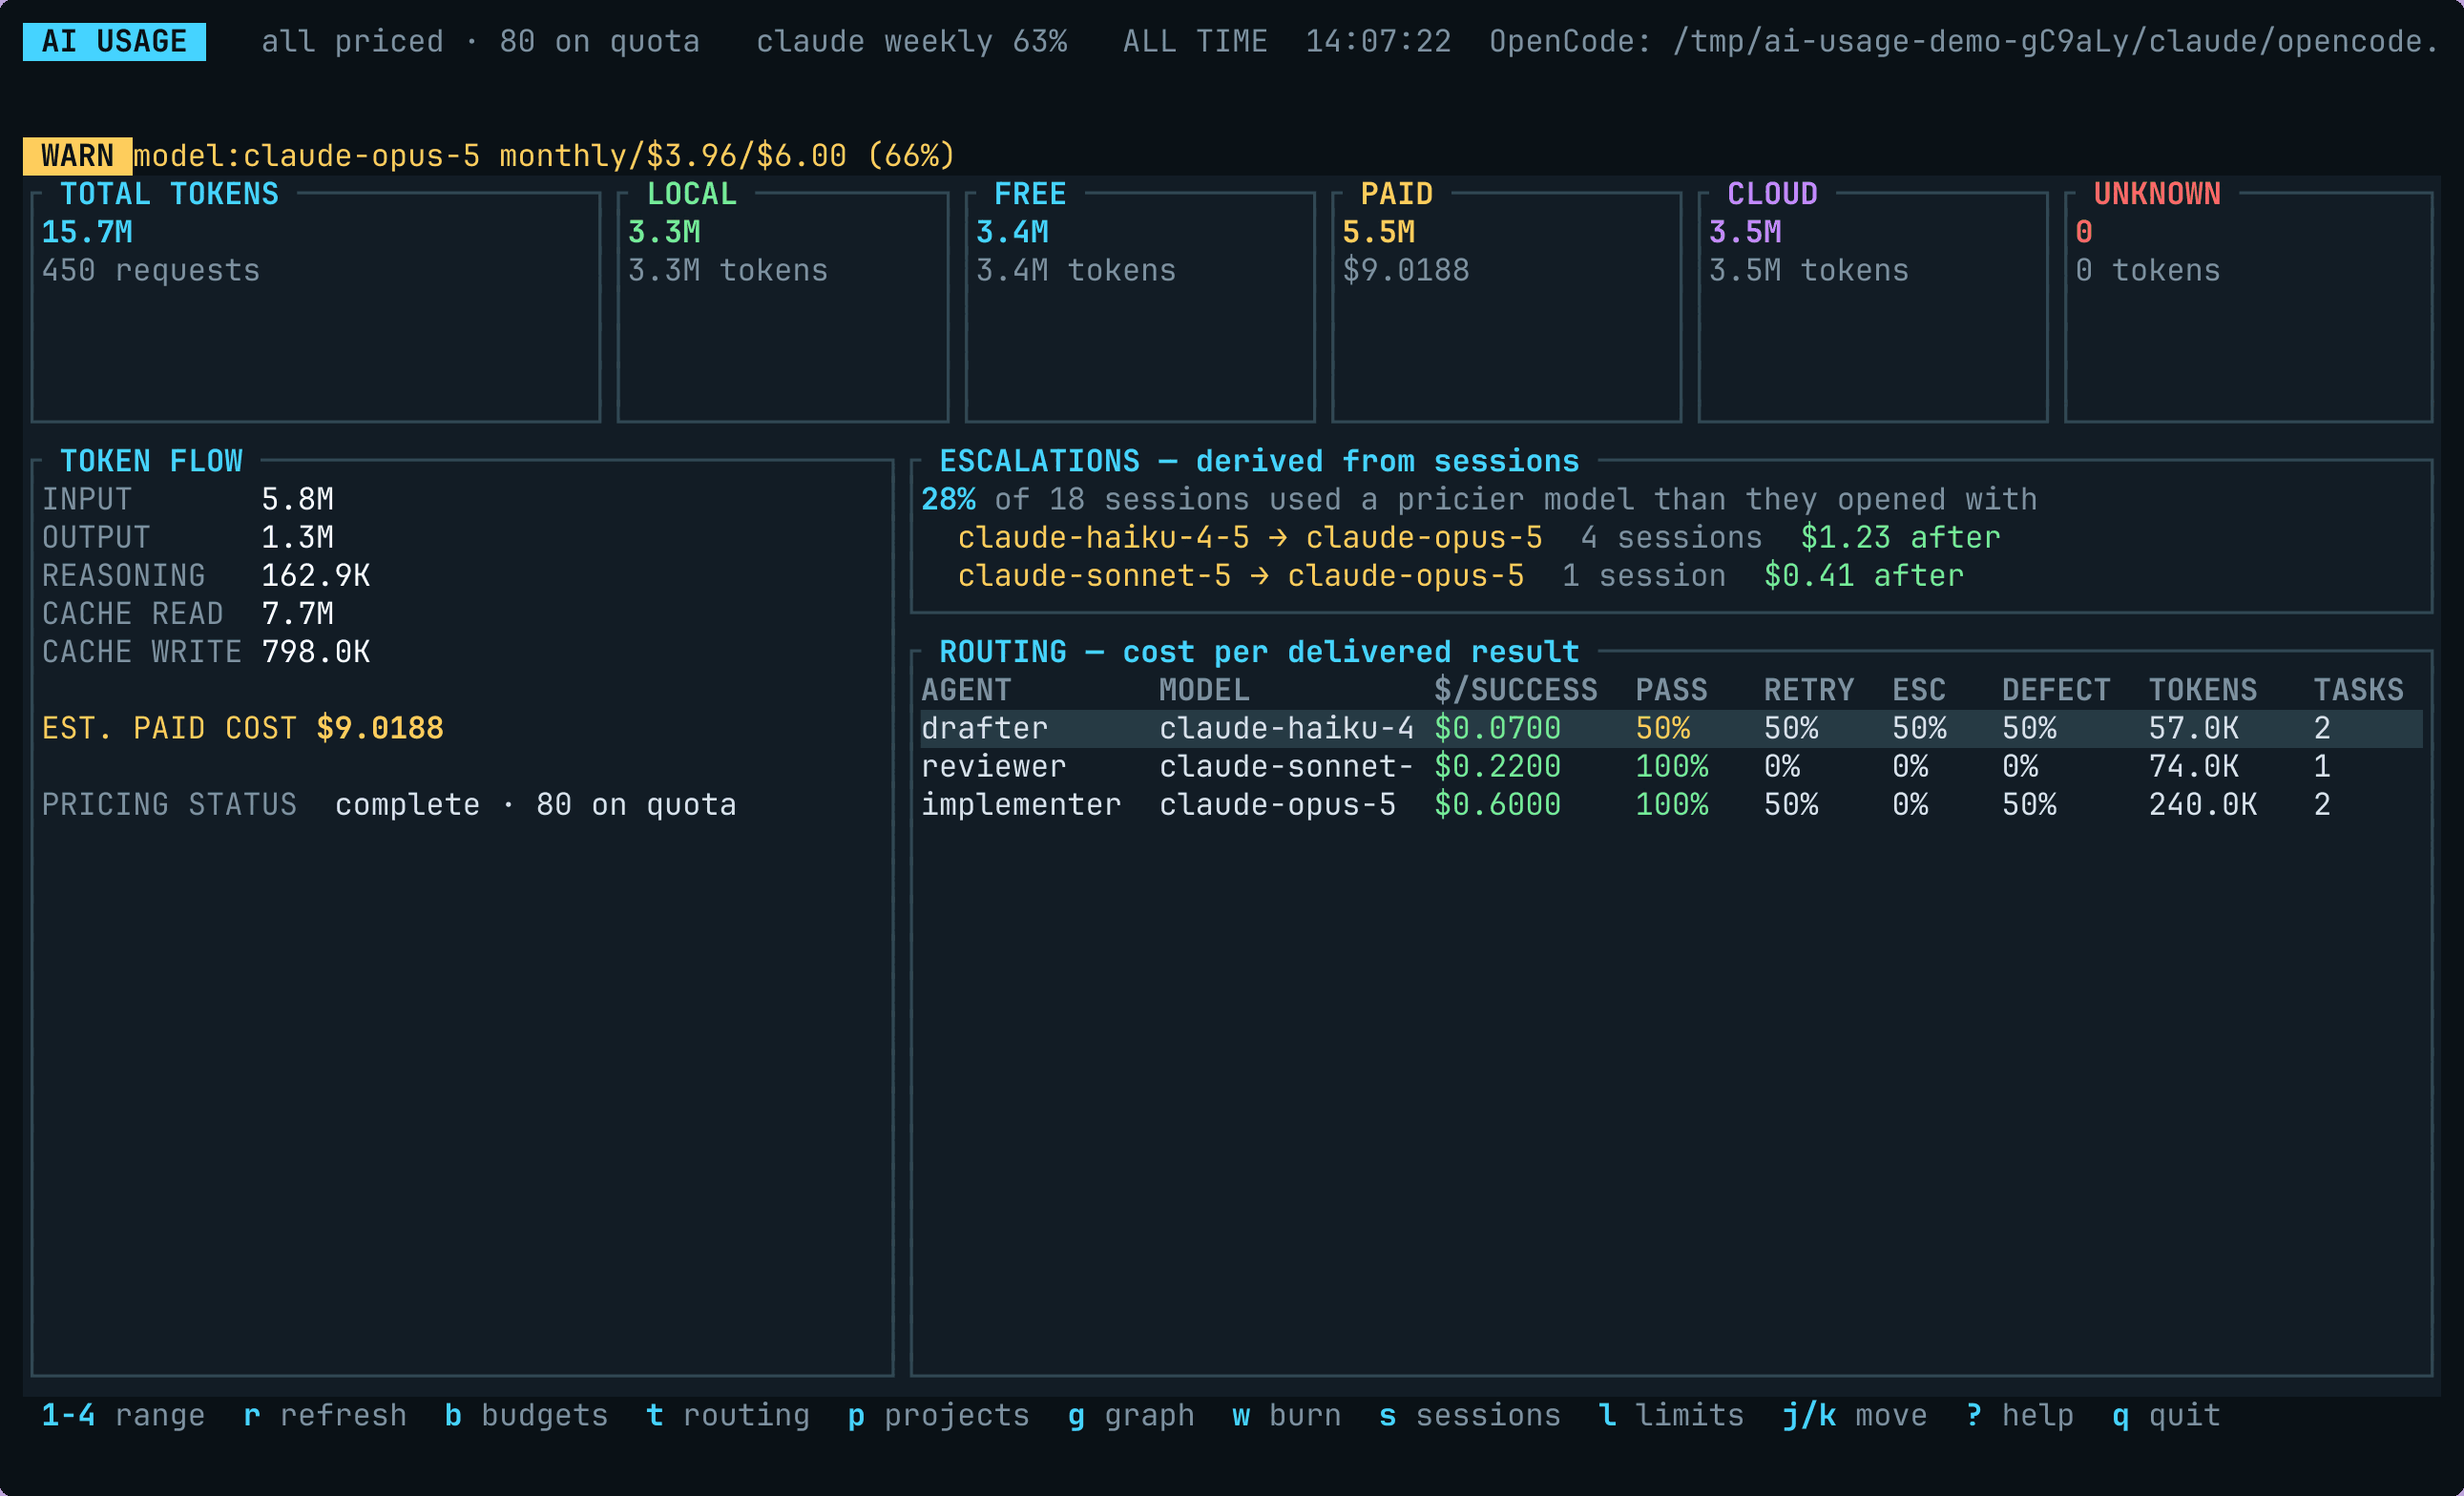
Pass/fail from the harness. The shipped Claude Code hook turns a PostToolUse payload into a routing event when it observed a test run, decides whether the exit status was the runner’s, prices the attempt with the same billing decision as everything else, and writes through the same journal path as manual recording. The routing view then shows cost per passing test, escalations between models, and what each escalation cost afterwards.
A privacy boundary with a test behind it. Session transcripts contain prompts, completions, file contents and whatever a tool printed, including secrets read from a .env. The collector parses only the usage block and a handful of identifiers. A test plants a fake credential in a transcript line and fails if it appears anywhere in the resulting record. The Omarchy reader in the same boundary reads six display fields per subscription and never the OAuth token.
What I would walk through in an interview
- Why the registry pattern beat the obvious “just add it to both places” fix, and what the test that enforces it looks like.
- The billing decision: how a request is classified LOCAL, CLOUD, FREE, PAID or UNKNOWN, and why PAID is about who bills rather than whether a figure is known.
- Tailing JSONL by byte offset: what happens on log rotation, truncation, and a half-written last line.
- The release pipeline: one workflow producing crates.io, a Homebrew tap, a Scoop bucket, and PKGBUILD and Chocolatey packages as release assets, with the README screenshots rendered from invented demo data so no real spend ever appears in an image.
What is next
Cursor has no collector because its usage is not on disk in a form the tool can read honestly; the README says so rather than estimating. The routing analytics are the part I want to push further: review-defect rates are recorded but the sample sizes are still small enough that the dashboard shows the count beside the rate.